Download
1 / 17
170 likes | 234 Views
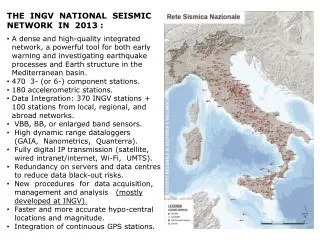
WP4: Integrated products for supporting seismic crises. Rome- June 1 9th , 2014. Agenda. 10:00-10:10 Review of WP objectives (N. Pierdicca)

E N D
WP4: Integratedproducts for supportingseismiccrises Rome-June19th, 2014
Agenda • 10:00-10:10 Review of WP objectives (N. Pierdicca) • 10:10 – 10:30: Task 4.1 Velocity and soil vulnerability: objectives, progress status, data availability (including validation site), others(GAMMA, IG) • 10:30 – 10.45 Task 4.1 Soil vulnerability from velocity: the approach (INGV) • 10:45 – 11:00 Discussion (All) • 11:00 – 11:20 Task 4.2 Change detection from medium resolution images: objective, progress status, data availability (including validation site), envisaged approach (INGV + DIET) • 11:20 – 11:40 Task 4.3 Change detection from high resolution images: objective, progress status, data availability (including validation site), envisaged approach (DIET + INGV) • 11:40 – 11:50 Discussion (All) • 11:50 - 12:10 Task 4.4: Data integration: objective, progress status, structural vulnerability, data availability (including validation site) (DIET + DISG) • 12:10 – 12:25 Task 4.4 Use of coseismic deformation and shake maps(INGV) • 12:25 – 12:35 WP 400 Support to user requirements: product definition (DIET + All) • 12:35 – 12:45 Task 4.5 Product generation: survey of possible validation sites (INGV + IG) • 12:45 - 13:00 Discussion (All) • 13:00 End of meeting
WP4 objectives • Develop an integrated approach for generating maps of a damage likelihood parameter both at the scale of few building blocks or of individual buildings, depending on the available EO data Dept. Information Engineering, Eletronics, Telecommunications (DIET) • Work breakdown • Data sets • Main calibration area: L’Aquila earthquake • Validation area still TBD (New Zealand earthquake ?)
Task 4.3 objectives • Develop an automatic procedure for detecting earthquake damages in urban settlement at the scale of individual buildings, from Very High Resolution (VHR) satellite data. • Test case • L’ Aquila earthquake (April 6th, 2009)
L’ Aquila Earthquake: data availability • Optical / PanchromaticDataset (QuickBird) Pre-event Post- event • SAR SpotlightDataset (COSMO- SkyMed) Pre-event Post- event
L’ Aquila Earthquake: data availability • SAR StripmapDataset (COSMO- Skymed) Pre-event Post- event
L’ Aquila Earthquake: SAR images analysis • Complex geometry of changes • Layover effect from gable roofs as well as double bouncing mechanism can be observed • Displacements in the SAR images depend on looking angle and on building height COSMO-SkyMedpre-post-post (22/03/2009 – 05/04/2009) Off- nadir angle= 19.07° COSMO-SkyMedpre-post-post (07/04/2009 – 13/04/2009) Off- nadir angle= 50.57°
L’ Aquila Earthquake: SAR images analysis • Problem in superimposing SAR data at low looking angle to other data as map, NDVI map and so on. Building position in the SAR imagetakenby COSMO- SkyMedwithanobservation angle of 19.07° • Despite of problems in sloped terrains, SAR data acquired at smaller observation angles exhibit higher contrast and better sensitivity to change. QuickBirdPost-event (09/04/2009) COSMO-SkyMedpre-post-post (22/03/2009 – 05/04/2009) Off- nadir angle= 19.07° COSMO-SkyMedpre-post-post (07/04/2009 – 13/04/2009) Off- nadir angle= 50.57°
L’ Aquila Earthquake: SAR images analysis • Comparison between coherence computed within a ROI (i.e., the layover or double bounce return area) and coherence computed within a moving window (averaged within the ROI)
Verypreliminaryassessment(feasibilitystudy) • Used data • Optical data • SAR data • Metodologies • Optical data:damagevisual detection bycomparingpre- and post- eventimages • SAR data:classificationapproachbased on a DecisionTreeAlgorithm (DTA)
Preliminary procedure (feasibilitystudy) • SAR data: methodology flow chart Pre-event SAR image Pre-event SAR image Co-registration and radiometriccalibration Featuresextraction DecisionTreeAlgorithm (DTA) Masking NDVI Ground Survey Segmentation Comparaisonbeetwendamagemap and groundsurvey Damagemap
Verypreliminaryprocedure • SAR data:DecisionTreeAlgorithm (DTA) YES YES YES NO YES NO NO NO
Verypreliminaryassessment • Confusion Matrix from Optical data (buildings). By photointerpretationwecheckedifdamaged building s according to groundsurveyappearchanged in the image (no way to evaluateomissionerrors) • ConfusionMatrix from SAR Spotlight. Weapplied the preliminary procedure and comparedchangedobjected with groundtruth.
A Priori information for Earthquake damage mapping Likelhood Index Damage Map
Data integration : building vulnerability • Prior information of building (structural) vulnerability will be exploited to produce the Damage Likelihood Index (task 4.4) • Identification of most significant input data, easy to collect, reliable and their processing require a massive analysis and calibration of existing data in the test site • Building map (seeexample on the right) • Building type, age, height, # of floors, shape, and so on • Detailedoccupancy (??) certificates (seeformsbelow) to calibrate the algorithmagainstreliablegroundtruth • DIET will be • supported by L’Aquila: occupancy (confomity ?) certificate
Product definition To be definedaccording to userrequirement task. Twooptions: • Scale of single building For each building, probability PN of damage of grade N • Contribution from EO expectedonly for For each building, probabilityP5of damage of grade 5 • Scale of block of building: Collapse ratio: percentage of building fullydestroyed (damageclass 5) • From medium resolution images is the percentage of changedpixelsbelonging to classurban • From VHR images is the percentage of building with P5>threshold (TBD)