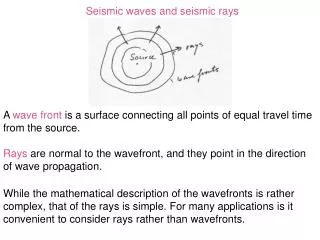
Download
1 / 16
160 likes | 332 Views
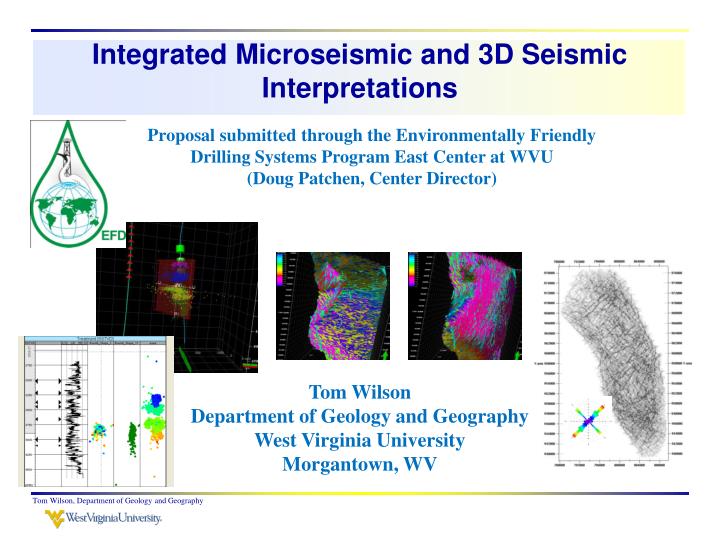
Integrated Microseismic and 3D Seismic Interpretations. Proposal submitted through the Environmentally Friendly Drilling Systems Program East Center at WVU (Doug Patchen, Center Director). Tom Wilson Department of Geology and Geography West Virginia University Morgantown, WV.

E N D
Integrated Microseismic and 3D Seismic Interpretations Proposal submitted through the Environmentally Friendly Drilling Systems Program East Center at WVU (Doug Patchen, Center Director) Tom Wilson Department of Geology and Geography West Virginia University Morgantown, WV Tom Wilson, Department of Geology and Geography
General objectives of the project • Develop a 3D seismic interpretation of an active Marcellus shale gas development area; • Incorporate available geophysical logs and subsurface data into the geophysical characterization and subsurface interpretation; • Position microseismic events in the subsurface stratigraphic framework and 3D seismic interpretation; • Evaluate relationship between seismic scale fault networks, other seismic attributes and microseismic distribution; • Create a workflow you can use and modify for decision making on placement of future laterals. Tom Wilson, Department of Geology and Geography
Task 1.0 3D seismic analysis Subtask 1.1 Database creation. Bring data sets including 3D seismic and well log data together in a common interpretation and computational platform. Subtask 1.2 Calculate synthetic seismic response, integrate well log data into seismic and develop a velocity function. Subtask 1.3 Conduct basic interpretation of 3D seismic. Subtask 1.4 Convert 3D seismic to depth and accurately position laterals & microseismic events in the depth volume. Subtask 1.5 Develop/test various 3D seismic discontinuity detection workflows to enhance seismic features that may influence fracability Use microseismic response for validation/calibration. Tom Wilson, Department of Geology and Geography
Post-stack processing will be conducted in time and depth domains. Accurate depth conversion is necessary. Already exist? Use synthetic seismogram to tie well log data into seismic & develop velocity function. Microseismic velocity function may be used to improve seismic event tie for depth conversion. The Burley #1 well (a “nearby” deep well) provides some regional control on deeper velocity distribution. Tom Wilson, Department of Geology and Geography
Pre & post stack depth migrations are only as good as the velocity function The data collected over this WV site had obvious anomalies associated with an incorrect elevation correction velocity. In this case the elevation correction velocity was much to low. With the datum above the valleys, seismic events across valleys were associated with time-structural low in areas of subsurface structural high. Tom Wilson, Department of Geology and Geography
Basic workflow Post-stack processing workflows will be developed to meet the needs of this area and the unique properties of this reservoir interval. Discontinuities will be extracted in time and depth domain for comparison. Other attribute workflows will be developed and evaluated in the context of microseismic responses. Tom Wilson, Department of Geology and Geography
Task 1.0 3D seismic analysis (continued) Subtask 1.6 Conduct orientation analysis of extracted discontinuities Subtask 1.7 Develop composite fracture distribution and intensity drivers using seismic discontinuities and other seismic attributes Subtask 1.8 Develop model discrete fracture network Subtask 1.9 Compute porosity and permeability distributions in the DFN Tom Wilson, Department of Geology and Geography
Orientations of seismic discontinuities.How do they fit in the context of regional structure/tectonic history? anomalous trend Less pervasive J2 trend ~ J1 trend ~ SHmax trend FMI logged fractures in the Oriskany Ss. Aarre et al., 2012 Optimal Lateral Orientation Analysis of seismic discontinuity trends in Marshal Co., for example, reveals both expected and anomalous trends. What does the microseismic reveal? Tom Wilson, Department of Geology and Geography
Composite fracture driver: derived from discontinuity and max curvature normal to SHmax Fracture perm Ki Upscaled driver DFN seal (multilayer) Tom Wilson, Department of Geology and Geography
kj and cumulative kj through a portion of the seal Hmax Lateral Integrated kj perm kj perm Tom Wilson, Department of Geology and Geography
Task 2.0 Microseismic evaluation Subtask 2.1 Bring microseismic data into the database Subtask 2.2 Examine microseismic for presence of master fracture zones (what does the distribution of microseismic events tell us?) Subtask 2.3 Integrate microseismic into Task 1 efforts Tom Wilson, Department of Geology and Geography
Microseismic display and integration capabilitiesPetrel/Nemo time magnitude Uncertainty ellipsoid and BB diagram Early event Main event Late event Sonic s/ft Sonic s/ft Tom Wilson, Department of Geology and Geography
Evaluating shale production within the context of microseismic response Not stress directions but orientations of probable fractures in these areas. Fan et al., 2010 Toelle, 2012 Tom Wilson, Department of Geology and Geography
Project schedule Tom Wilson, Department of Geology and Geography
Recent publications on related work Journal Papers Oudinot, A., Koperna, G., Philip, Z., Liu, N., Heath, J., Wells, A., Young, G., and Wilson, T., 2011, CO2 injection performance in the Fruitland coal fairway, San Juan Basin: Results of a Field Pilot: Society of Petroleum Engineers, SPE 127073, 864-979. Wilson, T., Wells, A., Peters, D., Mioduchowski, A., Martinez, G., Koperna, G., Akwari, B., and Heath, J., 2012a, Fracture and 3D Seismic Interpretations of the Fruitland Coal, San Juan Basin: Implications for CO2 Retention and Tracer Movement: International Journal of Coal Geology, 99, pp. 35-53. http://www.sciencedirect.com/science/article/pii/S0166516212000432. Wilson, T., Siriwardane, H., Zhu, L., Bajura, R., Winschel, R., Locke, J., Bennett, J., 2012b, Fracture model of the Upper Freeport coal: Marshall County West Virginia pilot ECBMR and CO2 sequestration site: International Journal of Coal Geology 13p., http://dx.doi.org/10.1016/j.coal.2012.05.005. Weber, M., Wilson, T., Akwari, B., Wells, A., and Koperna, G., 2012. Impact of geological complexity of the Fruitland Formation on combined CO2 enhanced recovery/sequestration at San Juan Basin pilot site. International Journal of Coal Geology, 104, pp 46-58. See http://dx.doi.org/10.1016/j.coal.2012.09.011, T. Wilson corresponding author. Wells, A., Diehl, J., Strazisar, B., Wilson, T., Stanko, D., in press, Atmospheric and soil-gas monitoring for surface leakage at the San Juan Basin CO2 pilot test site at Pump Canyon New Mexico, using perfluorocarbon tracers, CO2 soil-gas flux and soil-gas hydrocarbons. International Journal of Greenhouse Gas Control, 28p. Procedings Wilson, T., Weber, M., Bennett, J., Wells, A., Siriwardane, H., Akwari, B., Koperna, G., 2012. Fracture Model, Ground Displacements and Tracer Observations: Fruitland Coals, San Juan Basin, New Mexico, CO2 Pilot Test: Proceedings of the International Pittsburgh Coal Conference, 13p. Meeting presentation Wilson, T., Smith, V., Brown, A., Gao, D., 2012. Modeling discrete fracture networks in the Tensleep Sandstone: Teapot Dome, Wyoming: AAPG Search and Discovery Article #50658, 4p. Tom Wilson, Department of Geology and Geography
References cited Aare, V., Astratti, D, Dayni, T., Mahmoud, S., Clark, A., Stellas, M., Stringer, J., Toelle, B., Vejbaek, O., and White, G., 2012, Seismic detection of subtle faults and fractures: Oilfield Review, 28-43. Rich, J. P., and Ammerman, M., 2010, Unconventional geophysics for unconventional plays; SPE 13179, SPE unconventional gas conference Pittsburgh, PA. Fan, L., Thompson, J., and Robinson, J., 2010, Understanding gas production mechanisms and effectiveness of well stimulation in the Haynesville Shale through reservoir simulation; CSUG/SPE 136696, Canadian unconventional resources and international petroleum conference , Calgary, Canada. Toelle, B., 2012, Shale plays evaluation – finding production sweet spots: Schlumberger NeXT course, Houston, TX. Questions? Tom Wilson, Department of Geology and Geography