Download
1 / 7
130 likes | 250 Views
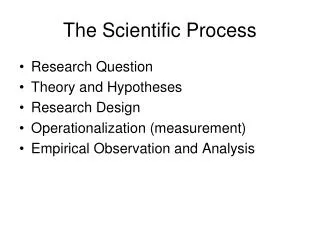
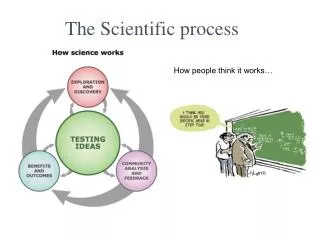
The Scientific Process: Making Observations. I. Making Observations - Observations can be made several different ways. Observations can be put into two different categories; qualitative and quantitative.

E N D
I. Making Observations- Observations can be made several different ways. Observations can be put into two different categories; qualitative and quantitative.
A. Qualitative Observations- These types of observations look at the qualities that something has. Observations that can be observed using the five senses, are considered qualitative. (Examples: Color, texture, shape, smell, taste, sound, etc…)
1. Qualitative observations are usually recorded using data tables, drawings, and journaling. Cameras and video equipment can also be used to record qualitative observations.
B. Quantitative Observations- Some observations are made by making measurement of objects or conditions. Any observations that involve quantities or numbers of any kind, are considered quantitative. ( Examples: Temperature, Length, Mass, Volume, Density, quantities, etc…)
1. Quantitative observations are usually recorded in data tables or journaling. The data is then placed into charts or graphs to make the information easier to understand and share. The most commonly used graphs in science are line graphs, bar graphs, and circle graphs.
2. Quantitative observations can also be recorded using technology and computer. We call this automated data collection.