Download
1 / 59
590 likes | 690 Views
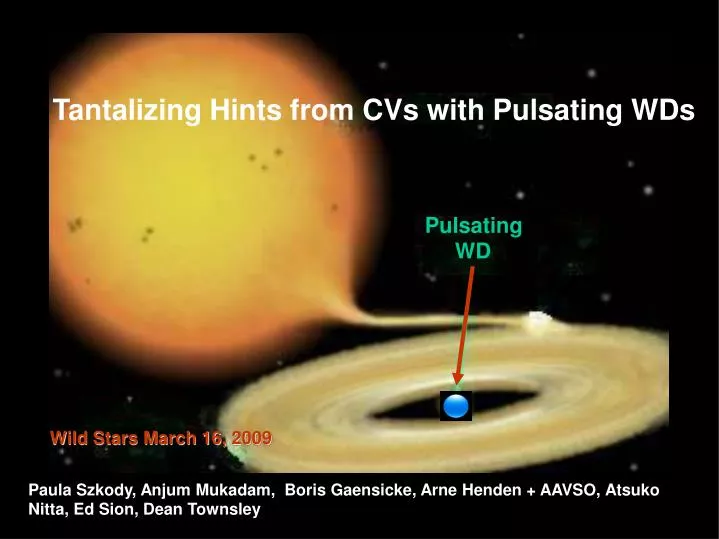
Tantalizing Hints from CVs with Pulsating WDs. Pulsating WD. Wild Stars March 16, 2009. Paula Szkody, Anjum Mukadam, Boris Gaensicke, Arne Henden + AAVSO, Atsuko Nitta, Ed Sion, Dean Townsley. Why study WD pulsators ?. Pulsations probe inner stellar structure

E N D
Tantalizing Hints from CVs with Pulsating WDs Pulsating WD Wild Stars March 16, 2009 Paula Szkody, Anjum Mukadam, Boris Gaensicke, Arne Henden + AAVSO, Atsuko Nitta, Ed Sion, Dean Townsley
Why study WD pulsators ? Pulsations probe inner stellar structure uniform density; pulsations penetrate the inner 99% of white dwarf Asteroseismology allows determination of: • Mass (total and H layer) • Rotation rate • Core Composition • Cooling rate
Why study accreting WD pulsators ? Find effects of accretion on pulsations • Heating due to accretion • Increase in angular momentum • Changing surface composition • Changing stellar mass
White dwarfs show non-radial g-modes on account of their high gravity Periods of 100s to 1000s • These modes are characterized by quantum numbers (k,l,m) similar to atomic orbitals kis #nodes between surface and center l is # nodes on surface (borders between hot and cool zones) m is # on surface that pass through pole of rotation axis
Modes of Pulsation m = 0 m = 0 l = 1 Stellar Surface l = 2 see www.whitedwarf.org m = 1 m = 1
Ideal short term seismology • Find a star with many (~10) pulsation modes • Identify the quantum numbers for each mode • Use WD pulsation models to get a unique fit to the observed periods Model fit Temperature, stellar mass H/He layer masses Model luminosity Distance to star Multiplet structure Magnetic field or rotation Model core composition 12C,16O nuclear reaction ratein RG stage
3 major questions: where is the instability strip for accreting pulsators? what are the affects of accretion and outbursts? is there any hope of pulling out mass, spin, etc?
Instability Strips for Non-InteractingWhite Dwarf Pulsators Our question: where is the instabilty strip for accreting pulsators? 25000K ZZ Ceti 11000-12000K
Step 1: Find some Accreting Pulsators Need: Cataclysmic Variables at quiescence with very short ~80-90 min orbital periods so accretion rate at a minimum 10-13 M/yr 90% of the optical light comes from the white dwarf So it’s possible to detect white dwarf pulsations! 13 known accreting pulsators to date
It’s a short history (1998-2009): Porb (min) V (mag) Ppulse (sec) Ref
Step 2: Get UV data Ly region allows best T determination Pulse amplitudes 6-17 x larger in UV
HST Programs 2002/2008 UV time-series spectroscopy Space Telescope Imaging Spectrograph (STIS) 1150-1750Awith 1A resolution, time-tag HST Advanced Camera for Surveys (ACS) Solar Blind Channel (SBC) 1200-1900Å 6-40A resolution, 1 min integrations Co-added Spectrum & Light Curve until SM4! UV data on 9 so far
Ground data are necessary: We need to know the optical state (to make sure object is at quiescence - HST insists) Simultaneous UV & opt pulsation amplitudes are needed to determine the mode
HST Obs Object Date Instrument AAVSO + help • HST picks week months in advance • AAVSO issues alert/web page ~ 2 wks-1 month before HST • AAVSO monitors • HST gives date/time 1 week prior to obs • ground obs 24 hr prior t akes halt off • HST observes with ground support
STIS on GW Lib fits with 2 component WD: 63% at 13,300K, 37% at 17,100K
SBC Fit to HST spectrum of SDSSJ0745+45 16,500 WD model Accretion disk
UV + opt with WD models HST data SDSS0745 16,500KWD 15,000K WD 12,000K WD SDSS data 10,000K WD
STIS + Calar Alto data on 20,000K V455 And = HS 2331+39 12,000K 11,000K 10,000K
HST data on PQ And SBC 12,000K 1200 1600 1400 1800 SBC+opt+WD models 15000 12000 10000
Temperatures from HST UV spectroscopySpectral Fits by Boris Gansicke Uncertainties ~ 1000K Object Date Instrument Temp (K) SDSS1507+52 Littlefair et al 2007 eclipse phot 11,000
Is the T difference a Mass difference? log g High mass DA WDs can get up to ~14000K Teff(K) Latest ZZ Cet instability strip (Gianninas, Bergeron, Fontaine, 2009)
Is it a Composition Difference? (Arras, Townsley & Bildsten 2006, ApJ, 643, L119) Helium Abundance < 0.38 Instability Strip like ZZ Ceti stars @11000-12000K Helium abundance > 0.38 Additional instability strip @ 15000K Helium Abundance > 0.48 Strips merge into a wide strip 11000-16000K Is the difference based on mass and evolution?
Another part of the enigma: Past HST observations show CVs with WDs T’s that should place them in the instability strip but they don’t show pulsations Of 7 WZ Sge stars with WD = 12-16000K, no obvious pulsations in EG Cnc, LL And, AL Com, HV Vir, WX Cet, VY Aqr, EF Peg Is this lack of data or lack of pulsations?
Szkody, Gansicke, Sion & Howell, 2002, ApJ, 574, 950 STIS data on EG Cnc T=12,300K WD
Optical data on SDSS 1339+48 - telescope and cadence matter 1.2m, 70s int 3.6m, 20s int
Further Clues come from the pulsation analysis... The first 4 observations were classic cases: UV periods same as optical UV/opt amplitude ~ 6-17 as predicted by theory
Orb 1 GW Lib HST-STIS Orb 2 Szkody, Gansicke, Howell, Sion 2002, ApJ Orb 3 Orb 4
Szkody et al. (2007, ApJ, 658,1188) in 2005 P=214s P=608s P=576s
UV+optical data allow fit to mode Teff = 14,500 SDSS1610-01 608s pulsation DA model for log g=8 by Atsuko Nitta with (Szkody et al. ApJ 658, 2007) Teff = 12,500 T from spectrum = 14,500K
Then it got complicated: PQ And showed optical but no UV pulse SDSSJ0745 and others showed no pulse in opt or UV!
2337s 1285s UV/Opt amplitude < 1! l=3?
Summary of Pulsations Object Opt Periods (s) UV Periods (s) UV/opt amp
Optical Data prior to HST on Long Period Pulsator SDSS0745+4538 Light curves Fourier transforms
But in 2007: Orb P
SDSS0745+4538 2007 2005-2006 30 Oct 31 Oct 1 Nov 2 Nov 6 peaks/ 7200 sec = pulsation 1.5 peaks/ 7200s = orbital
This accreting pulsator stopped pulsating between 2006 -2007! No respectable ZZ Ceti stops pulsating! [Anjum] BUT The Catalina Sky Survey detected an outburst of SDSS0745+45 in Oct 2006 - did this matter?
Possible Reasons for non-detection of pulsations: Unknown SOB occurred or Accreting pulsators have changing temperature, mass, angularmomentum & surface composition ??? We need long-term observations for each pulsator!
Long monitoring shows that amplitudes can change (Van Zyl et al 2004, MNRAS) GW Lib P = 650, 376, 236s
600s Patrick Woudt SAAO long term monitoring of pulsator SDSS0131 From Szkody et al. ApJ 658, 1188, 2007 335s 214s HST data June 2005 showed P=214s
3 major questions: where is the instability strip for accreting pulsators? what are the affects of accretion and outbursts? is there any hope of pulling out mass, spin, etc?
Known Outbursts of Accreting Pulsators: • PQ And (1938, 1967, 1988) • GW Lib (1983, 2007) • V455 And (2007) • REJ1255+26 (1994) • SDSS0745+45 (2006) • SDSS0804+51 (2006)
Pulsation Period: Means of measuring Teff ? Mukadam et al. 2005
AAVSO data plotted by Matt Templeton GW Lib outburst Apr12 07 May,June 07 more GALEX May, June 2008 GALEX WIYN,APO May29,June 1 (387+/-5s? 19 mma) ULTRACAM (Copperwheat et al. 2009)
A new periodicity is apparent 1 yr after outburst but not seen in UV ??? Before outburst: P=650, 370, 230s After outburst: P=1145+/-3 s Mar-June 2008 1145s Copperwheat et al. 2009 MNRAS: Mar-Apr 1154+/-10s June 21 296s
CTIO 4m spectrum: Tom Harrison Apr 2008 V~16.3 Boris fit: Twd= 23,000K, log g=8.46 Quiescent WD T=15,000K
AAVSO data plotted by Matt Templeton V455 And V455 And 2007-2009 Sept 07 V
1 yr past outburst: Pre SOB pulse? spin Post SOB
Pre-outburst photometry 0804+51 2 systems like this now known Phot P ~ 43 min Spect P = 85 min Spectra look like pulsators