Download
1 / 28
280 likes | 290 Views
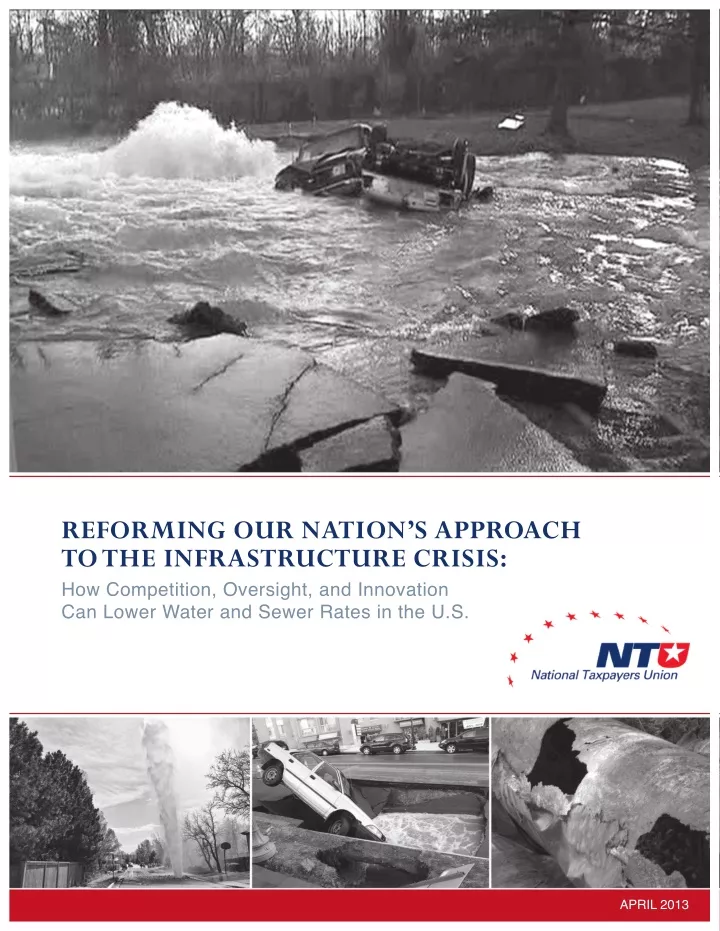
Reforming Our Nationu2019s Approach<br>To the infrastructure crisis:<br>How Competition, Oversight, and Innovation<br>Can Lower Water and Sewer Rates in the U.S.

E N D
RefoRming ouR nation’s appRoach to the infRastRuctuRe cRisis: How Competition, Oversight, and Innovation Can Lower Water and Sewer Rates in the U.S. ApRIL 2013
RefoRming ouR nation’s appRoach to the infRastRuctuRe cRisis: HOW COmpetItIOn, OveRSIgHt, And InnOvAtIOn CAn LOWeR WAteR And SeWeR RAteS In tHe U.S. ntu policy papeR #132 apRil 2013 By GreGory M. Baird Water Finance research Foundation
foRewoRd When taxpayers hear the word “infrastructure,” they are more likely to think of things such as roads and airports rather than water pipes and sewers. Yet, these buried assets are as important to our everyday lives and the economy as the transportation networks we see right before our eyes. Drinking water and wastewater infrastructure have huge implications for fiscal policy. As this policy paper points out, the costs to replace existing capacity and keep up with additional development growth could reach into trillions of dollars over the next several decades. this liability could rival the threat that state and local government employee pension burdens pose to taxpayers. And like so many undertakings by governments as well as their chartered entities, citizens are already being treated to a litany of reasons why the only solution to the water infrastructure problem is more money from their wallets – through higher utility rates, additional local debt, new taxpayer-funded grants from Washington, or other schemes. Pete SePP Executive Vice President National Taxpayers Union to national taxpayers Union, none of these “solutions” is acceptable. Just as water is a resource that must be carefully stewarded, the finances of taxpayers and ratepayers deserve better oversight and allocation. Several years ago, ntU embarked on a more in-depth examination of water infrastructure matters, which included an Issue Brief that focused on the topic of open competition for piping materials.1 the research complements our longstanding support for local government policy approaches that encourage greater involvement of privately-owned businesses in delivering public services. this policy paper picks up the question with a much more comprehensive evaluation of both the problems and the solutions. Water finance expert Gregory Baird brings formidable knowledge and experience to bear on the technical challenges of corrosion for replacement of outmoded pipe systems. But antiquated financial practices are much greater obstacles to success, and include defective competitive procurement laws, poor understanding of performance auditing or life-cycle costs, and a lack of accountability or transparency to those who must ultimately pay the bills. mr. Baird ably tackles each of these topics and makes a compelling case for reforms. He is far from alone. Recently the mayors Water Council of the U.S. Conference of mayors released a report methodically outlining how “procurement process improvements yield cost-effective public benefits.” The President of the influential U.S. Water Alliance also weighed in on the topic of materials procurement. While not taking sides on which material is best, he sensibly observed: Recent reports are highlighting the importance of choosing the right pipe for the right job and doing so in a manner that embraces competition rather than routine repetition. Smart selection, through open competition and upfront life cycle analysis, should then lead to sustainable asset management. Add it all up to save water, energy, and money over the long haul and prevent headaches along the way.2 But implementing such reforms is just as urgent as identifying them, which is why ntU teamed up with the Water Finance Research Foundation to develop practical steps citizens and public officials to make changes happen in their communities. Step one is to organize a community-level citizen group, which can consist of just a handful of concerned residents. Our brochure, Standing Together, provides all the nuts-and-bolts details of forming such an organization. Step two is to begin monitoring local procedures for replacing pipes, making capital plans, and setting service rates. A handy appendix to this policy paper provides 25 criteria that an informed public can use to probe these procedures intelligently and assess whether public officials are properly fulfilling their fiduciary duties. RefoRming ouR nation’s appRoach to the infRastRuctuRe cRisis 3
Step three is for taxpayers and ratepayers to seek solutions beyond their hometowns, through state- and federal- level legislation to ensure that all options for materials are considered from the beginning of a water or sewer replacement plan. Step four is for public officials themselves to regain the confidence of their constituents through transparent, proactive management of those new systems as they come online. The average citizen may feel somewhat daunted by the technical terms laced throughout this discussion. There’s no need to be. In the end, the most critical issues surrounding water infrastructure aren’t about pipe specifications or engineering tests. They’re about putting in place a set of principles that help any enterprise succeed: competition, oversight, and innovation. ntU is grateful to mr. Baird and the Water Finance Research Foundation for their vital work. We look forward to additional constructive cooperation in the years ahead as we seek to protect taxpayers and ratepayers in the quest for solutions to the underground infrastructure challenge. With Sincere Appreciation, Pete SePP Executive Vice President National Taxpayers Union 4 national taxpayeRs union
1. intRoduction: the uRgency of RefoRm “Crisis” is an overused word in public policy, but in the case of drinking water and wastewater infrastructure, it is not inaccurate. though they may not think of it often, more and more consumers seem to sense that serious problems are arising every time they learn of water-main disruptions or rising utility bills. eighty-eight percent of Americans think some type of reform is needed to help our infrastructure and 72 percent claim they would actively advocate for water reform.3 Yet, they are also demanding a break from the past as well as the present – new funding without fundamental changes in the way infrastructure is procured and managed will not restore public trust. What would such changes look like? 1.1 Procurement reform for oPen comPetition and innovation First and foremost, rate-approving officials and finance officers must take aggressive action to address the direct drivers behind rates. They have a fiduciary duty to conduct procurement audits – both process-related and financial – to ensure fair and open competition practices are followed. this reaches to the depths where special interests and others dictate design specifications prohibiting materials, technologies, or project delivery processes that could otherwise lower overall costs to utilities. Competition also drives innovation and reduced costs to the utility and ratepayers. 1.2 imProved financial management PracticeS Furthermore, improvements are needed in financial management strategies, such as combining infrastructure asset management programs with long-term financial planning. Innovation occurs when life-cycle costing is incorporated to reduce the exposure to unexpected future liabilities. The elements of long-term financial planning include forecasting economic trends, projecting revenues and expenditures, and debt analysis. Furthermore, infrastructure asset management, operations, maintenance, and capital planning all need to be tied to service levels and performance standards, and integrated with financial analysis so cost justification is an integral part of the decision-making process. the barriers to cost effectiveness unnecessarily drive up rates and, in many cases, probably have for years. All of them can and should be addressed before the immediate need for rate hikes. the best practices of asset management and integrated finance4 help bridge this gap of awareness and offer informed, practical solutions in order to maintain affordable water services. Indeed, as each day passes, elected officials are becoming increasingly aware of the need to confront this issue in a cost-effective manner. The U.S. Conference of Mayors has published a definitive study on local government procurement and maximizing public benefits. Pipe materials were used to illustrate procurement process improvements that can yield significant cost savings and extend useful design performance in the system. The report called for: an open procurement and selection process which allows for all appropriate materials to be considered and accurately and fairly compared. Any improvement in this area can represent a huge cost savings for ratepayers considering the perpetual high cost of underground infrastructure replacement. … Closed procurement processes lead to unnecessary costs, and may diminish public confidence in a local government’s ability to provide cost effective services.5 2. wateR and wastewateR infRastRuctuRe: an oveRview An overwhelming number of reports and studies provide evidence of needed change to the water and wastewater industry.6 The life-sustaining assets under this industry’s care have received a grade of “D-” in 2009 and a “D+” in 2013 from the American Society of Civil engineers (ASCe) for their condition, with a growing price tag estimated between $1 to nearly $5 trillion. the environmental protection Agency (epA) explains that nearly 60 percent of these costs are the underground pipes which have been out of sight and out of mind for too long. RefoRming ouR nation’s appRoach to the infRastRuctuRe cRisis 5
2.1 the critical need iS at the local level All of the national and state-level studies are based on survey sampling and extrapolated projections from many data sources. Breaking the issue down into smaller parts at the local level identifies the true gaps and risks. If a water main breaks, it impacts the services provided to the homes and businesses on that street and the ratepayers from the community’s utility will shoulder all of the costs. These smaller parts are more controllable and therefore solvable with known costs, benefits, and impacts. The accuracy of any of the gap estimates will only be improved as local communities conduct individual need assessments. Utility finance officers feel the struggle of balancing some degree of financial stability against the huge wave of capital investments. Elected officials, meanwhile, are caught in a “Catch-22” of feeling compelled to raise water rates amid economic uncertainty but feeling driven to protect their political futures. But is it all about finding new money, or perhaps scrounging just enough funding to get through the budget cycle? Or, are there strategies to actually reduce infrastructure costs in the short term and in the long term? this policy paper from national taxpayers Union is a call to action for utilities to embrace techniques that are within their control. By following practical approaches that promote competition, improved financial management, and innovation, water and sewer rate costs in the United States can be reduced. Financial management in utilities dictates a budget process in which funds are approved and allocated for specific purposes. Capital budgets with lists of prioritized projects are also reviewed and approved. toward the end of a budget year, the accounting records are organized and presented during a formal audit, which looks for misappropriated funds or weak internal controls. Yet, even with these high standards the additional tasks to help relieve financial burdens are all too often not on the agenda. Granted, finance officers can be experts at budget cutting and hiring freezes; they can be in control of accounting transactions and earn awards for clean audits with superior financial reporting; they can, like “captains of industry,” issue more debt. But how can they become masters of understanding the actual cost drivers? the following analysis is intended to provide some guidance. 3. the unfunded infRastRuctuRe liability the United States has a decentralized water network with approximately 54,000 community water systems serving over 264 million people and 114,000 non-community water systems delivering service to facilities like campgrounds and schools. There are over 14,700 wastewater treatment facilities and 19,700 sewer collection systems. At the same time, the costs of meeting current and future government employee pension commitments have become prominent issues for state and local governments in recent years, even as many have grappled with weak revenue and balanced-budget requirements.7 While the unfunded pension liabilities have driven high-profile negotiations in many areas of the country, the unfunded water and wastewater infrastructure liabilities with a lack of open procurement and life-cycle financial analysis practices continue to be unaddressed. And, just as they have often involved themselves in constructive campaigns for pension reform, community-level citizen groups can, through public outreach and engagement with the media, propose better water infrastructure practices to local City Councils or Boards with policy and budget authority. Ultimately, they can make a positive contribution to the public debate, one which will lower long-term utility rates or prevent them from increasing unnecessarily. 4. the majoR cost dRiveR is pipe Replacement As noted earlier, the majority (60 percent) of the water replacement costs are in the area of transmission and distribution pipes. given the economic downturn resulting in deferred maintenance and delayed capital projects, this proportion is expected to increase. If the amount was mostly financed through long-term 30-year debt to achieve a measure of inter-generational equity among ratepayers, the figure would go even higher. Ultimately, however, the public will have to finance the replacement of the nation’s water infrastructure, either through higher rates or higher 6 national taxpayeRs union
taxes. Local funds are expected to cover the cost of the great majority of the nation’s water infrastructure needs.8 Still, as then-detroit mayor dennis Archer, president of the national League of Cities observed, “the staggering cost of maintaining, operating, rehabilitating, and replacing our aging water infrastructure requires a new partnership between federal, state and local government.”9 4.1 Buried and out of Sight, almoSt forgotten the United States installed underground water infrastructure in three main time periods because of the population growth in the 1800s, 1900-1945, and post-1945. Pipes constructed in each of these three eras will all start to fail at nearly the same time over the next couple of decades for many reasons, ranging from age and corrosion to inadequate design and poor installation. Additionally, the life span of the materials used has become shorter with each new investment cycle.10 Utilities are faced with reviewing new methodologies and materials to select the best-fit, right-cost solution to longstanding problems. doing things the same old way and expecting different results cannot meet the standards of an effectively managed utility. pipe material selection considerations include trench conditions, corrosion, temperature, safety requirements, and cost. the main pipe characteristics, however, are corrosion and hydraulic considerations. All pipes are approved and tested by the American Society of testing materials as well as the American Water Works Association (AWWA). many have the “nSF” designation, which means they were tested for compliance with one or more voluntary national standards and undergo constant rigorous testing. these pipes are safe for their intended purpose, unlike, for example, asbestos cement pipes whose production and use the industry has discontinued. Furthermore, these various pipes have been thought to exhibit useful lives (if properly installed) at over 100 years. Unfortunately, recent hard experience demonstrates pipes not lasting that long, but having an average failure age of 47 years.11 metallic pipes in corrosive soils may last less than 10 years. A 2011 study by AWWA’s Water Research Foundation12 indicated that ductile iron pipes with the thinnest walls (now the majority of metallic pipe purchases) in moderately corrosive soils have a life expectancy of just 11-14 years. In contrast, projects involving underground pipes are usually supported through 30-year long-term debt even though accounting depreciation schedules assume a 75- to 100-year pipe life. As the author of the recent mayors Water Council report perceptively observed, “When pipes fail prematurely, huge long-term generational financial burdens are placed on the utility, unnecessarily increasing user rates. This is akin to having to completely rebuild one’s house before the first mortgage is paid off.”13 5. the coRRosion epidemic can no longeR be hidden Utilities are currently facing a large problem maintaining their infrastructure, partly because pipe manufacturers, owners, and engineers historically have failed to recognize and provide adequate corrosion control methods to protect buried cast iron and “ductile” (i.e., less brittle) iron piping and fittings. Despite warnings from corrosion experts in the late 1960s and again in the 1980s about possible corrosion problems, water and wastewater utilities continued the practice of installing metallic pipe without sufficient protection. Corrosion is now generally considered to be the major reason for below-ground pipe failures. the cost of repairing or replacing ferrous metal pipes is one of the largest expenditures in some utility budgets.14 For example, an October 1989 AWWA Journal article reported, “Research in philadelphia and Boston and observation of corrosion and main failure in Calgary, Denver, California’s East Bay Municipal Utility District, Los Angeles, and other utilities show that external corrosion is a major contributor to water main deterioration.” the author further noted that many utilities do not appreciate that corrosion has led to conditions eventually causing the leak or break.15 this could include circumferential cracks, which make up 50 percent of common failures.16 Water main breaks are a key cost driver that finance officers should understand. They should explore the type of pipe, the pipe age, and the break/leak cause. Sustainability concerns would strive for a pipe life of 100 years or more. RefoRming ouR nation’s appRoach to the infRastRuctuRe cRisis 7
Corrosion-related failures should prompt an immediate review of pipe material selection criteria. In sewer collection systems, both pipe and manhole materials should be non-corrosive to achieve a 100-year life. 5.1 Water main Break StudieS Utah State University’s (USU’s) Water Main Break Rates in the USA and Canada study was released in 2012. the USU Buried Structures Laboratory is recognized as one of two laboratories in the United States for performing large-scale tests on buried pipes. It is from this expertise and background that the surveys of water main breaks were developed and analyzed. Utah State University examined utilities across the U.S. and Canada to obtain comprehensive data on water main failures of municipal and private water supply systems. the failure rate was computed by dividing the total number of failures from all utilities for a particular pipe material by the total length of that pipe material. this simple method for computing failure rates was used because it discourages biases toward large or small utilities. moreover, utilities experience widely different failure rates for the same pipe material owing to pipe age, soil types (corrosive or noncorrosive), different corrosion prevention techniques, different installation practices, and climate. 5.2 non-corroSive PiPe haS the loWeSt Break rate the USU study concluded that pipe made from polyvinyl Chloride (pvC, a type of durable plastic) has the lowest overall failure rate when compared to Cast Iron (CI), ductile Iron (dI), Concrete, Steel, and Asbestos Cement (AC). PVC is shown to have the lowest overall failure rate at an overall 2.6 main breaks level, comprising the U.S. at 2.9 and Canada at 0.7. The study also found that corrosion is a major cause of water main breaks. Seventy-five percent of all utilities have corrosive soil conditions, and combined with a high portion of CI and dI pipes, one in four main breaks is caused by corrosion. this is ranked the second-highest reason for water main pipe failure.17 5.3 corroSion control iS an added coSt the major issue in the pipeline market is the selection of materials and choice of corrosion control protection methods. Corrosion control costs can mean the market difference among different pipe types. As water is becoming a more precious and expensive resource and leak repair costs escalate, useful life and reliability are becoming more critical to utilities faced with major rehabilitation of their infrastructure.18 In an article entitled “Corrosion, not Age, is to Blame for most Water Breaks,” the author estimated that an average of 700 water main breaks will occur each day in north America. these 250,000 annual breaks will cost approximately $1 billion per year.19 the author states that most people believe old age is the major contributor to iron water pipe main breaks, but it is actually corrosion damage, as older pipes can continue to operate as long as corrosion is controlled: the majority of water piping installed in the 20th century was cast or ductile iron, which was expected to provide water utilities with 50 to 100 years of trouble-free services. Unfortunately, these pipes are susceptible to corrosion and subsequent breakage. … Ductile iron pipe, introduced to the water systems in the 1950s and still in use today, was intended to offer better quality than cast iron. However, the pipe’s matrix and thinner wall make it vulnerable to pitting and corrosion attack. Another materials expert determined that the rate of premature corrosion failures is attributable primarily to the thinner-wall ductile iron pipe, but also to galvanic corrosion from copper service lines and increased corrosivity from use of road salts.20 He wrote: In summary, the corrosion problem which waterworks utilities are facing on a national basis is the result of many years of questionable practice and standards. Both gray cast iron and ductile iron have a similar, natural tendency to corrode in soil. ... On the other hand, the corrosion of ductile iron pipe has awakened the waterworks industry, after half a century, to an appreciation for the potential severity of corrosion. 8 national taxpayeRs union
5.4 liSten to the exPertS: the coStS of corroSion are real the historical failure of the water and wastewater community to adequately address corrosion is best summarized in the report, Corrosion Cost and Preventive Strategies in the United States, completed in 2001.21 the Federal Highway Administration and national Association of Corrosion engineers International (nACe) jointly supported the study, mandated by the U.S. Congress. the study points out that the total cost of corrosion per year in the U.S. is $276 billion, or approximately 3 percent of the nation’s Gross Domestic Product. A disturbing revelation is that the largest single component of this annual corrosion cost is the water and wastewater sector, at $36 billion. Current estimates in today’s dollars increase this to nearly $50.7 billion.22 According to the study, major reasons for this problem are the lack of understanding corrosion and the lack of corrosion control. It states that many utilities have contributed to their own problems by their approach where “often an attitude is taken of burying the water pipe and forgetting about it until it fails.” the authors maintain that corrosion- related costs may add up to “approximately 50 percent of the total budget of the water departments.” 5.5.1 maP: u.S. corroSion Source: Data collected from Soil Survey Staff, Natural Resources Conservation Service, U.S. Department of Agriculture Soil Survey Geographic Database. http://soildatamart.nrcs.usda.gov. 5.6 corroSion rate Initially, ductile iron was advertised as exceeding the corrosion resistance of gray cast iron.23 this idea gained acceptance in the marketplace and allowed the thinner-wall ductile iron pipe to replace cast iron pipe. However, research by the national Bureau of Standards (now the national Institute of Standards and technology) indicated decades ago that ductile iron, cast iron, and steel corrode at similar rates in low-resistivity soils.24 Additional national Bureau of Standards testing concluded in a 1976 article that ductile iron and steel “buried in the same soils…corrode at nearly the same rates when encased in some soils. Different soils, however, alter the corrosion rates for both materials”.25 Furthermore, in its 75-year review of research, the ductile Iron pipe Research Association (dIpRA) acknowledges that for practical purposes ductile iron and cast iron can be considered to corrode at the same rate.26 RefoRming ouR nation’s appRoach to the infRastRuctuRe cRisis 9
Hence, the map above provides a relevant illustration of regions most susceptible not only to steel corrosion, but cast and ductile iron corrosion as well. 5.7 reduction in iron PiPe Wall thickneSS However, the thinner wall of ductile iron pipe is one of the factors that contribute to its shorter useful life compared to cast iron. Historically, the extra thickness of the cast iron pipe provided more metal for corrosion to attack (i.e., a corrosion allowance). As shown in the chart below, the historical wall thickness difference in some cases can be as much as 75 percent thinner for a similar pressure and diameter pipe. If the wall thickness of ductile iron is only one-fifth of the cast iron wall thickness and the corrosion rate is the same, then the expected life of ductile iron will be substantially less than for cast iron in similar corrosive environments. the difference in wall thickness is one consideration that must be taken into account during corrosion evaluations and selection of control methods. Some utilities are specifying increased ductile iron pressure classes for additional wall thickness in an attempt to provide a larger corrosion allowance. 5.7.1 chart: iron PiPe Wall thickneSS reductionS over time 1.58 in. 1.22 in. 0.94 in. 0.87 in. 0.58 in. 0.43 in. 0.38 in. 0.21 in. 1908 CLd CI 1952 CL 150 CI 1957 CL 23 18/40 CI 1957 CL 22 21/45 CI 1976 CL 3 dI 1985 CL 50 dI 1991 CL 150 dI planned Actual size of AWWA Specification Thickness Reductions for 36-inch Diameter Cast and Ductile Iron Pipe – 1908 to Present (150 PSI Operating pressure) Source: Industry standard knowledge and specifications. Measurements depicted in inches, by year. “CI” and “DI” refer to cast iron and ductile iron, respectively. The U.S. Conference of Mayors report referred to earlier in this Policy Paper only confirms this trend, and indeed directly refers to it: the thick cast iron pipes have taken a long time to corrode and need to be replaced, but the thick pipes of the past are no longer manufactured. the most commonly used substitute material is ductile iron pipe and it has been widely installed over the last few decades. the walls of ductile iron pipe are made thinner than cast iron, a 76 percent reduction in wall thickness since 1908 – 1.58 inches to 0.38 inches by 1991 – to reduce cost. Recent reductions thin the pipe wall to 0.21 inches. the simple fact is that thinner metallic pipes, under similar soil and moisture conditions, corrode and fail more quickly than their thicker cast iron predecessors.27 10 national taxpayeRs union
6. Reducing shoRt-teRm costs while dRiving up long-teRm costs the main driver of reducing the wall thickness of iron pipe has been to attempt to reduce costs. One major issue with such strategies is the effect on pipe performance. When a utility invests in pipe, it normally will issue 30-year debt on a capital replacement project and assume that the longevity of the pipe will be in the 75- to 95-year range. Water leaks in the later years are inevitable. The water industry’s application of best practices, including the use of life-cycle costs, raises issues such as maintenance and life expectancy. In this case, the life-cycle cost of a pipe is not the initial purchase and installation price, but the value received through the pipe asset from cradle to grave. Using this technique, the apparent wall thinning in corrosive soil conditions exposes the weaknesses of metallic pipes. 6.1 life-cycle coStS American and european sources consider pvC to have a durable life expectancy over 110 years.28 Yet, many utility general managers ask, “How long will pvC really last?” european testing has suggested over 170 years.29 dig- ups in Canada and the U.S. of nearly 40-year-old pvC pipe prompt similar questions, considering once the pipe is washed off, “it looks like new.” various life-cycle assessments have also found pvC to be a prudent choice. the discussion of life-cycle costs should not be confused with academic studies known as “life-cycle analyses” (LCAs). A life-cycle cost comparison looks at the costs to the user of a product from purchase through disposal. Life-cycle analyses, on the other hand, attempt to account for all the environmental impacts of a given product, from production through use and disposal. depending on the data categories that are included, LCAs may provide useful environmental information, but they are not a substitute for life-cycle cost comparisons.30 7. plastic wRapping of ductile iRon pipe is not a nace standaRd Both ductile iron pipe manufacturers and dIpRA usually promote plastic wrapping, a passive type of protection, as the principal method to control corrosion for all external ductile iron pipeline burial conditions. However, acceptance of polyethylene encasement as a successful corrosion control method is still a volatile and controversial subject in the corrosion control community. the technique has been adopted as a standard (C105) by the American Water Works Association and the American national Standards Institute, but it is not regarded as such by the influential national Association of Corrosion engineers (nACe).31 7.1 A TAxpAyer’s CAll To ACTion If the corrosion control experts at nACe will not set the use of plastic-wrapped ductile iron as an approved corrosion standard, then informed citizens and elected officials need to take note of the current practice of their utility. Long- term performance and intergenerational equity of underground pipe investments for their community may be at stake. If a pipe is replaced with some remaining life, money is wasted, but more egregious is the premature failure and performance of pipes that were hailed as having a 110-year life. An awareness of soil conditions, major causes of failures (e.g., corrosion), and life-cycle costs all need to be combined at the earliest and most prominent decision point in the public procurement and design specification process. A utility might be reluctant to make such decisions in a public-record environment, and might even avoid updating its old practices in a public fashion so as not to expose weaknesses of past policies. nonetheless, for ratepayers this is a critical juncture where they must speak out, and demand their utility clarify its commitment to controlling rising costs. RefoRming ouR nation’s appRoach to the infRastRuctuRe cRisis 11
8. if coRRosion is not an issue aRe you still conceRned about cost? 8.1 underStanding the Big dollarS Overall, the “averaged replacement value” of the water underground pipe infrastructure adds up to $2.14 trillion in 2010 dollars based on core 2002 infrastructure data.32 This figure is based on a common unit cost derived from ductile iron costs and weighed against estimated pipe lengths found in various regions among four size categories of utilities. Also, on average, if the epA has stated that nearly 60 percent of the replacement cost needs are the underground pipes, then one estimated value of the U.S. water system is over $3.6 trillion, with $2.14 trillion attributable to pipes. Following this logic and the chart below, the replacement value of iron pipes subject to corrosion would include cast iron (CI), cast iron cement lined (CICL), and ductile iron (dI), totaling over $1.36 trillion, or 63.6 percent of the total value of water pipe underground infrastructure. 8.1.1 chart: aggregate of PiPe tyPe and averaged rePlacement value in millionS of dollarS By region and utility Size region ci cicl di ac Pv Steel PccP total northeast large 48,958 8,995 5,050 2,308 1,875 335 0 67,522 northeast medium & Small 66,357 61,755 28,777 26,007 16,084 5,533 6,899 211,411 northeast very Small 14,491 15,992 10,661 7,281 7,937 329 462 57,152 midwest large 37,413 9,151 3,077 2,504 1,098 784 512 54,539 midwest medium & Small 74,654 92,106 51,577 37,248 30,506 8,682 11,152 305,925 midwest very Small 37,597 28,943 25,464 12,428 19,720 601 828 125,581 Southeast large 30,425 28,980 29,569 21,229 14,936 9,337 7,227 141,703 South medium & Small 54,772 98,608 140,079 103,659 102,804 21,394 17,160 538,475 South very Small 43,183 24,998 49,791 34,529 47,823 1,461 1,244 203,028 West large 15,448 16,055 28,949 14,774 14,723 7,443 6,215 103,607 West medium & large 15,775 50,145 70,355 50,541 48,885 12,276 9,806 257,782 West very Small 16,344 11,199 17,910 13,166 17,245 545 453 76,862 total 455,416 446,927 461,258 325,674 323,637 68,719 61,957 2,143,589 CI: cast iron; CICL: cast iron cement lined; DI: ductile iron; AC: asbestos cement; PV: polyvinyl chloride; PCCP: prestressed concrete cylinder pipe Source: AWWA, “Buried No Longer: Confronting America’s Water Infrastructure Challenge,” 2012. http://www.awwa.org/Portals/0/files/legreg/documents/BuriedNoLonger.pdf. The water industry’s proven issues with corrosion combined with the findings of the 2012 USU Water Main Break Study, provide a rich background for cost analysis: nearly 75 percent of water utilities have corrosive soils, 66 percent of the pipes are less than 8 inches in diameter (representing mainly residential water distribution systems), and 83 percent of water utilities operate at an average delivery pressure of 77 psi with less than a 20 psi pressure fluctuation (meaning that the risk of stresses on these utilities’ pipes are relatively modest). Again, the Conference of Mayors has just issued a report on local government procurement and maximizing public benefits. Pipe materials were used to illustrate procurement process improvements than can yield significant cost savings and extend useful design performance in the system.33 As the following chart indicates, there are some serious affordability differences among materials. 12 national taxpayeRs union
8.1.2 chart: Pvc coStS verSuS di coStS, By PiPe Size in incheS and dollarS Per linear foot $120.00 PiPe Selection iS aBout choice and affordaBility $100.00 $80.00 Backfill Cost $/lf labor cost $60.00 di material cost $40.00 Pvc $20.00 $0.00 4 6 8 10 12 14 16 18 20 24 4 6 8 10 12 14 16 18 20 24 PiPe Size Source: Water Finance Research Foundation. www.waterfinancerf.org. 8.2 Potential Water induStry coSt SavingS over time for ratePayerS By using the total replacement value by pipe type and realizing that different pipe materials are priced differently, it is possible to engage in a fiscal exercise with great importance to cost-conscious officials, taxpayers, and ratepayers. the two main pipes being installed today are ductile iron pipe and pvC pipe. Cast iron is no longer manufactured and is a primary factor in the number of water main breaks and pipe replacement capital programs. Water distribution systems are typically made of pipes with a diameter of less than 12 inches. Larger pipe diameters normally would mean increased water pressures. to create a cost comparison using the charts above, the variables needed are material type, pipe diameter, pressure, and cost components. here is a way to understand the calculation: 1. Account for the fact that this iron pipe would be a proportional part of the 75 percent of utilities experiencing corrosive soil conditions. 2. Apply USU’s finding that 66 percent of pipe is less than 8 inches in diameter. 3. Factor in that 83 percent of the pipe has a low pressure and low risk of pressure fluctuation. 4. pvC is considered to be between 30 percent and 70 percent less expensive than ductile iron pipe depending on the diameter of less than 12 inches. Bottom line: an average cost savings of 50 percent. this percentage can be translated into dollars: • By replacing CI and CICL with PVC, an average cost savings would be an estimated $245 billion, (ranging from a low of $148 billion to a high of $345 billion) or 11.5 percent of the total replacement value of all pipe. • By replacing DI with PVC – assuming corrosion was an issue, the pipe is less than 8 inches in diameter and not subject to pressure concerns – the average cost savings is estimated at $126 billion (ranging from a low of $76 billion to a high of $177 billion) making up 5.9 percent of the total. A shift in pipe selection from old iron and ductile iron pipe materials, taking into account various design specification variables, could reduce the current estimated total replacement value of iron metallic pipes from $1.362 trillion to $991 billion. RefoRming ouR nation’s appRoach to the infRastRuctuRe cRisis 13
the Bottom line: a national application of switching from iron and ductile iron pipes to Pvc, given open procurement and cost justification analysis, could benefit water ratepayers and taxpayers in the average total amount of $371 billion, or 17.4 percent of the total replacement value of u.S. water underground pipe infrastructure. additional savings can be achieved in pipe diameters greater than 8 inches, boosting this amount even higher. these cost savings to be achieved would take place over time but would need to be initiated at the local level as part of the infrastructure asset management planning and procurement process. If the 40-year replacement need from 2011 through 2050 alone was considered, an estimated $165.5 billion in savings would occur, with $91.6 billion in savings between 2011 and 2035, and an additional $73.9 billion from 2036 through 2050. The remaining savings would occur beyond 2050. existing ratepayers would, through user fees, underwrite the repair and replacement of existing infrastructure as assets continue to degrade over time. 8.3 Potential Water induStry coSt SavingS over time for develoPerS Developers pay for the infrastructure that benefits growth and economic development through connection fees, impact charges, or system development charges. Utilizing the same principles discussed above, the 17.4 percent in cost savings could be applied to an estimated $498.3 billion in growth-related pipes that are needed through 2035. projections from 2036 to 2050 would add nearly another $304 billion, for a 40-year estimated total of $802.2 billion in new underground pipe infrastructure. these estimates are contained in the AWWA 2012 report.34 A 17.4 percent factor, accounting for variables in determining dI versus pvC, applied to these new pipe needs, results in savings of $86.7 billion through 2035 and an additional $52.9 billion through 2050. the Bottom line: a national application of switching from iron and ductile iron pipes to Pvc where warranted, given open procurement and cost justification analysis, could benefit local developers supporting economic development in the total amount of $139.6 billion through 2050. 8.3.1 chart: aggregate need for inveStment in Water mainS through 2035 and 2050, By region 2011–2035 totals (2010 $m) replacement growth total northeast $92,218 $16,525 $108,744 midwest $146,997 $25,222 $172,219 South $204,357 $302,782 $507,139 West $82,866 $153,756 $236,622 total $526,438 $498,285 $1,024,724 2011–2050 totals (2010 $m) replacement growth total northeast $155,101 $23,200 $178,301 midwest $242,487 $36,755 $279,242 South $394,219 $492,493 $886,712 West $159,476 $249,794 $409,270 total $951,283 $802,242 $1,753,525 Source: AWWA, “Buried No Longer: Confronting America’s Water Infrastructure Challenge,” 2012. http://www.awwa.org/Portals/0/files/legreg/documents/BuriedNoLonger.pdf. 14 national taxpayeRs union
8.4 Potential coSt SavingS By region and utility Size the AWWA 2012 report35 and its total replacement value calculations (Chart 8.1.1) considered region and utility size. In the analysis of the pipe material distribution, the large utilities of the northeast and midwest had a much higher percentage of iron and ductile pipes, 93 percent and 91 percent respectively (as compared to the average large utility of 76 percent). By region, the average combined utility size subject to iron pipes is 64 percent, while the Northeast and Midwest are at 80 percent and 79 percent in comparison. Larger utilities are considered serving populations of 50,000 or more; they therefore have the ability to spread cost against a larger user rate base as compared with small and very small utility sizes (serving less than 10,000 and 3,300, respectively). In general, even though they have corrosive soils, the West and the South have less exposure to corrosion failures based on their low percentage of iron pipes installed and therefore have higher levels of pvC pipes. Likewise, medium and small utilities also have less metallic corrosion exposure due to higher use of pvC pipe. these smaller and even rural water systems have followed competitive procurement policies and selected pipe materials to meet both cost and performance requirements. 8.5 develoPer coSt SavingS By region Growth estimated in the four regions was calculated in the AWWA 2012 study as 2.9 percent in the Northeast, 4.6 percent in the midwest, 61.5 percent in the South, and 31 percent in the West through 2050 for a total needed investment in new pipe infrastructure of $802.2 billion through 2050. the South and West, through an applied PVC procurement cost scenario, would gain 92.5 percent of the $139.6 billion in developer and economic benefits through 2050. Sixty-two percent of the $139.6 billion could be achieved between 2011 and 2035 if current water main pipe replacement projects adopt recommended open procurement and financial analysis practices. Therefore, public officials and taxpayer advocates in those two regions have a particularly strong interest in ensuring such practices are embraced. Regions currently applying these principles have already begun to capture cost savings. 8.6 the deBate naturally, these scenario estimates will come under challenge from pipe associations, manufacturers, utilities, and other stakeholders. However, their protests miss the point of NTU’s focus: demanding open procurement practices supported with financial analysis and followed with a commitment to public accountability. Indeed, if these interests do have concerns, then the first step is for utilities to initiate the internal changes allowing for alternative materials in the design specifications for underground water and wastewater infrastructure. It is precisely by establishing open procurement practices and life cycle-costing that the data-centered conclusions in this Policy Paper can be properly debated. to be clear, this analysis for national taxpayers Union is the most comprehensive one currently available. It is built on an AWWA study represented as the “most comprehensive picture of the nation’s water pipe inventory ever assembled” and a USU water main break study examining “10 percent of total length of water mains in the U.S. as one of the largest surveys ever conducted.” Yet, this research can and should be updated. More studies are forthcoming and welcomed to help utilities better manage their renewal and replacement infrastructure asset management, planning, and decision making. the second step is for the utility to conduct a public review and financial analysis of its operations. the issue at hand is not really the selection of one pipe over another, but the ability for a utility to take advantage of all materials, processes, technologies, and products that create the most cost-effective solution while meeting sustainable performance levels. In fact, every pipe has its best use, but no single pipe is the best fit in every situation. Open competition only, not accusations, will reach the objectives of elected officials, ratepayers, and developers concerned with the rising costs of infrastructure replacement capital programs. RefoRming ouR nation’s appRoach to the infRastRuctuRe cRisis 15
8.7 the doing nothing oPtion If a utility chooses to ignore the problem or continues to defer capital replacement projects to avoid basic rate increases, the investment gap will significantly rise and the costs of the projects will increase, creating a larger future liability for ratepayers. establishing a multi-year condition assessment program as part of the capital plan budget and methodically conducting an annual condition analysis is the only way an organization can understand risks and adjust capital replacement plans cost effectively. Unlike a needs assessment, which centers on identifying funding shortfalls, the condition assessment is critical to managing a strategic investment that will actually reduce the risks. 9. the wateR infRastRuctuRe state of cRisis Utilities are constantly caught between two pressures. On one hand, there are high replacement costs of underground infrastructure (again, epA suggests that underground infrastructure accounts for nearly 60 percent of the repair and replacement costs of the utility). the following chart, based on American Society of Civil engineers estimates, shows these replacement costs are considerable. 9.1.1 ChArT: sTATes’ WATer infrAsTruCTure funding requiremenTs california neW york texaS illinoiS maSSachuSettS PennSylvania WaShington florida neW JerSey State minneSota oregon north carolina colorado georgia miSSouri virginia maryland arizona nevada 0 2 4 6 8 10 12 14 16 18 20 $,B’s Source: ASCE Infrastrructure Report Card On the other hand, there is the political push-back dealing with rate increases and affordability issues. As a result, many managers are turning to long-term capital project and infrastructure financial planning, to demonstrate the cost savings between pvC and ferrous materials while overcoming corrosive issues and matching long-term performance. Also, the completion of a long-term infrastructure financial plan and asset management plan is critical to attracting and protecting investors. But regardless of the source of borrowing, it is still the ratepayers who must foot the bill. The ratepayer, like an owner, is on the hook for all utility and financial management decisions. As this section will show, by applying the 60 percent general rule of thumb for pipes and 17.4 percent for pvC design specifications, a great deal of savings can result at the state and local level. 16 national taxpayeRs union
9.2 Survey of utilitieS revealS PiPe Procurement Policy challengeS In a quick survey by the Water Finance Research Foundation in 2012, a number of utilities were asked some of the following questions: 1. Does your agency have open procurement practices/specifications which allow for more than one type of pipe material? 2. Has your agency conducted a cost justification for using one pipe material over another? 3. Has this cost justification been used as a part of a capital plan/rate increase reduction strategy? 4. When issuing bonds, have the credit agencies or bond holders asked about this type of open procurement, cost justification analysis, or the unfunded liability of infrastructure replacement? The surprising results were that some our nation’s largest utilities answered “No” and “Not at this time”. Even as some cities admitted to having no infrastructure replacement strategies which could save ratepayers money, they are also on the financially distressed and the “we need federal funding to pay for our infrastructure” lists. These cities include Chicago, detroit, new York, Boston, Atlanta, philadelphia, and Los Angeles. Alarmingly, each of their metropolitan areas represents thousands of miles of pipe and serves millions of customers. 9.3 Potential State SavingS – a feW examPleS the following chart provides additional illustrations of savings for drinking water infrastructure (not including sewers) based on the methodologies outlined previously. many of these scenarios rely on needs assessments provided by the American Society of Civil engineers. Actual experience could vary on a number of factors, including whether ASCE’s estimates prove to be too high or too low. Furthermore, this chart is based on ASCE’s 2009 data. Very recently released ASCE data for 2013 indicate that many states have even higher estimated replacement costs than before. this would naturally mean greater potential savings in dollars for pvC than indicated on the next page. RefoRming ouR nation’s appRoach to the infRastRuctuRe cRisis 17
chart 9.3.1. Potential PiPe-rePlacement SavingS for drinking Water infraStructure, uSing methodology of 60 Percent rePlacement-coSt Share and 17.4 Percent Pvc SavingS estimated savings, Wfrf’s ***methodology State estimated replacement cost georgia* $9.02 billion $940 million Illinois* $13.41 billion $1.41 billion massachusetts* $8.56 billion $894 million michigan* $11.31 billion $1.18 billion new Jersey** $7.9 billion $825 million new York* $14.81 billion $1.55 billion pennsylvannia* $10.99 billion $1.15 billion *2009 baseline for initial water investment cost is the estimate for a state’s water infrastructure investment “requirements” for a 20-year period. See http://www.infrastructurereportcard.org/state-page. note: many amounts have increased based on the 2013 American Society of Civil engineers report card. **Baseline for initial water investment cost is an estimate contained in a new Jersey Spotlight article citing a draft study by the organization Facing Our Future, which noted, “between 20 percent and 22 percent of the state’s treated drinking water is lost long before it’s delivered to households and businesses.” The report projects that $7.9 billion will have to be invested in the state’s water infrastructure over the next five years; with wastewater treatment facilities, the figure rises to $36.6 billion. http://www.njspotlight.com/stories/13/03/03/blue-ribbon-panel-reveals-shaky-state-of-nj-s-water- gas-power-and-transportation-infrastructures/. ***Source: Water Finance Research Foundation. www.waterfinancerf.org. 9.4 Potential SavingS – other areaS Metropolitan areas can likewise realize significant cost savings based on the methodology established in this Policy paper. 9.4.1 chicago Chicago’s bond documents and financial records were reviewed by the Water Finance Research Foundation. In Chicago, from 2008 through 2011, residential water rates increased 15 percent, 15 percent, 14 percent, and 14 percent. In 2012 they jumped by an astounding 25 percent. Future annual increases of 15 percent are planned from 2013 through 2015, after which rates will rise 5 percent each year. Operational increases for the Chicago Water Management Department are planned at 3 percent a year during 2011-2015. The lion’s share of the price tag is a huge capital plan for the replacement of one-fifth of the City’s underground pipes, of which 60 percent will be debt-financed. The sewer rates will automatically increase as water rates increase. Meanwhile, a $1 billion initiative was announced for water-related projects. Chicago’s objectives are to replace 88 miles of pipe a year for 10 years with ductile iron pipes at $2.2 million per a mile ($193.6 million), leaving the existing old corroded iron pipes in the ground. The terrible financial consequences of higher rates, higher debt, and distressed economic development for the next few decades will be borne by Chicago residents and 125 surrounding suburban communities. By applying the conservative 17.4 percent for PVC pipe use, Chicago could save $33.6 million, or replace over 18 more miles of pipe. 18 national taxpayeRs union
9.4.2 detroit Detroit’s water main replacements call for ductile iron because the current design specifications do not allow for alternative materials like pvC. In a brief analysis of comparing ductile iron budgeted costs against potential PVC pipe savings, an estimated $5.1 million to $8.5 million, could result (see chart below). Yet, Detroit finds itself in the middle of political, legal, financial, and operational turmoil. 9.4.2.1 chart: detroit Water caPital Plan detroit (dWSd) Water Supply System ciP Pvc SavingS urban System improvements 2012–13 2013–14 total 30% 40% 50% Water main replacements 8”, 12”, 16” di polywrap $1,000,000 $600,000 $1,600,000 $480,000 $640,000 $800,000 Water System improvements replace 28,925 di 6” 8” 12” 16” $4,950,000 $1,050,000 $6,000,000 $1,800,000 $2,400,000 $3,000,000 Water System improvements replace 38,390 di 6” 8” 12” $7,500,000 $1,900,000 $9,400,000 $2,820,000 $3,760,000 $4,700,000 $17,000,000 $5,100,000 $6,800,000 $8,500,000 Possible $5.1m to $8.5m savings $11,900,000 $10,200,000 $8,500,000 neW eStimate Source: Water Finance Research Foundation calculations based on city budget documents. www.waterfinancerf.org. 9.4.3 neW york city New York City’s vast system processes 1.3 million gallons of wastewater a day through 14 facilities, while small village systems process less than 100,000 gallons a day. the conservative cost estimate of repairing, replacing, and updating New York State’s municipal wastewater infrastructure had increased from $21.82 billion in 2004 to $36.2 billion in 2008 (both estimates over a 20-year horizon).36 Thus, significant savings are available here too, from judicious application of open procurement and asset management. the recent mayors Water Council report contained a success story of interest to ratepayers throughout new York and the nation: Former Schenectady, nY mayor Brian U. Stratton faced millions of dollars of underground infrastructure replacement costs. Stratton directed staff to conduct research and carefully review the available pipe material alternatives. He then made the mayoral decision to direct the city engineers to change the traditional practices which excluded pvC in a closed bid¬ding process. Affordability was a major concern. His demonstrated leadership drastically reduced the cost of capital plans and the long-term projections of maintenance costs.37 RefoRming ouR nation’s appRoach to the infRastRuctuRe cRisis 19
10. constRuctive Responses to the evidence Besides sources referred to above such as the American Water Works Association and the American Society of Civil engineers, the critical condition of our infrastructure is also becoming an issue to organizations concerned with broad aspects of public policy. these include the national governors Association, the Council of State governments, the national Association of Counties, the national Conference of State Legislatures, the national League of Cities, the International City/County Management Association, the National Association of State Budget Officers, the National Association of Home Builders, and the Government Finance Officers Association. Many of them are confronting the issue of long-term pension liabilities fraught with variable estimates of their consequences. However, unfunded infrastructure liabilities actually have known decay curves with a fairly well-established level of predictability. Luckily, at least, some members of these organizations have identified ways to address the infrastructure dilemma without immediately pulling out the rate (increase) card. As noted before, a standout among these groups is the U.S. mayors Water Council, which actively promotes open procurement and innovative strategies to meet water infrastructure funding needs. Its latest report finds: the experience of nearly a century of habitual procurement of water and wastewater pipes has had a costly impact on local repair and replacement programs. While this tradition is difficult to change, several proactive cities have broken with tradition and have reformed their procurement processes. Recognizing the growing record of success of alternative, corrosion-proof pipe materials, these cities have performed open procurement analyses to make procurement decisions on water and wastewater pipe material selection. Cities that have reviewed their pipe material options and performed objective analyses have chosen more cost-effective and better performing pipe materials for their water systems. As a result, alternative pipe materials are gaining wider acceptance and providing a cost effective method to address failing pipe issues.38 Another trend-setter is the American Legislative exchange Council, whose model legislation offers state and local governments a blueprint to address the pressing needs of their water and wastewater systems. the legislation would “ensure that open procurement procedures are utilized in the selection of piping materials for water and wastewater infrastructure projects undertaken by state or local agencies where state funding is used.” the goal is “to construct a project at the best price and best value for system customers and taxpayers.” this proposal, should it achieve widespread enactment, would help to regain the lost public trust in their leaders’ capacity to manage infrastructure replacement without making the same mistakes. 10.1 The rATepAyers’ response: A CAll for AffordABiliTy The economic considerations of current and future ratepayers should focus on the issue of affordability, as defined by each community’s unique circumstances, infrastructure requirements, and demographics. For, one result of affordability is sustainability. this revolution of future water policy is the joint responsibility of ratepayers and their water utilities’ authorities at all levels. This is neither a call for “investment” nor radical rate increase cessation. It is, simply, a call for financial justification, consistent oversight of performance, and transparency for ratepayers. A correctly informed citizen, confident that public officials have heeded this call, will allocate the necessary resources to protect the future value of water. 20 national taxpayeRs union
11. conclusion: a new plan foR wateR finance, a new Respect foR RatepayeRs the simple question for policymakers and utility managers is whether the increased tempo of infrastructure spending that utilities must face over the next 20 years can be financed by the utilities themselves at rates customers can afford. Evidently, the issue is more about funding than engineering. However, mastering this challenge calls for the utmost collaboration and alignment between a number of professional disciplines. the degree to which utilities achieve success is directly tied to the degree utilities are able to bring together engineers, finance professionals, and elected officials, all of whom must in turn develop and commit to a practical plan for reform. Finance staff must aggressively implement sound infrastructure asset management practices, while ensuring that the vision of open procurement becomes reality. this strategy then needs to be consistently updated and communicated to the ratepayers, who deserve regular consultation, progress reports, transparency, and accountability for performance. the most desirable outcome is a predictable, long-run plan leading to lower-than- expected rate increases in the future.39 Americans may not always pay attention to the pipes beneath their feet that provide the flow of water sustaining their everyday lives, but they are not oblivious to their value. At the same time, public officials cannot be oblivious to the value of the precious financial resources those Americans have committed – and will be asked to commit – to water infrastructure. A new plan for water finance goes hand-in-hand with a new respect for ratepayers. about the wateR finance ReseaRch foundation The Water Finance Research Foundation (WFRF) is a nonprofit organization that is dedicated to finding solutions for local governments and utilities to address the challenges of managing aging infrastructure, developing funding options, and mitigating a decline in the workforce. the WFRF (www.waterfinancerf.org) promotes municipal infrastructure asset management practices which increase efficiencies while reducing long-term operations, maintenance, and capital costs. Gregory M. Baird has experience with increased water and sewer rates as a financial officer and CFO in California and Colorado. Mr. Baird serves as an advisor to the Government Finance Officers Association (GFOA) Economic development and Capital planning Committee for the US and Canada. He is the founder and lead in creating a national GFOA Utility Finance Forum for utility finance officers to share experiences and knowledge. He continues to help train finance professionals on the benefits of infrastructure asset management planning and investment and the issues of long-term funding and rate affordability. mr. Baird is also member the American Water Works Association’s (AWWA) national Rates and Charges Committee and affordability sub-committee and contributed to the recent m1 manual on principles of Water Rates, Fees, and Charges update. mr. Baird has been working with condition assessment and monitoring, finance and risk, asset management, optimization, trenchless technology, GIS/CMMS and design-build firms to bring value and cost efficiencies back to utilities. As a result, he has leveraged his understanding of multi-functional disciplines required to address the water challenges of the 21st century. mr. Baird is widely published nationally and internationally explaining the financial side of utility management issues. He is the co-founder and co-author of the monthly Money Matters column in the prestigious AWWA Journal. He is recognized as a top contributor to the national discussions on the aging water and wastewater infrastructure funding dilemma and is dedicated to researching, developing and applying solutions as best practices. RefoRming ouR nation’s appRoach to the infRastRuctuRe cRisis 21
notes 1 Hollands, Bruce, The Underground Infrastructure Crisis: Rebuilding Water and Sewer Systems without a Flood of Red Ink, national taxpayers Union Issue Brief #176, January 18, 2010. http://www.ntu.org/news-and-issues/transportation- infrastructure/ntuib176undergroundinfrastructurecrisis.pdf. 2 grumbles, Ben, “Openly materialistic,” Ben Grumbles’ Pipeline Blog, U.S. Water Alliance website, April 25, 2013. http://www. uswateralliance.org/2013/04/25/openly-materialistic/. 3 Xylem, Inc., “the value of Water Index,” 2012, accessed march 2013. http://www.xyleminc.com/valueofwater/report/index.ht ml#overlay=none&page=3&question=01&panel=navigation. 4 Baird, gregory, “the Future of Water Infrastructure Asset management, part 2: protect Your Funding…Because All Roads Lead to Finance,” AWWA Journal, march 2013. http://www.awwa.org/publications/journal-awwa/abstract. aspx?articleid=36032967. 5 Anderson, Richard F., ph.d., Municipal Procurement: Procurement Process Improvements Yield Cost-Effective Public Benefits, U.S. Conference of mayors, mayors Water Council, march 2013, p. 14. http://www.usmayors.org/publications/ media/2013/0422-waterprocurementWp.pdf. 6 See, for example: U.S. environmental protection Agency, The Clean Water and Drinking Water Infrastructure Gap Analysis, September 2002, http://www.epa.gov/ogwdw/gapreport.pdf; U.S. Congressional Budget Office, Future Investment in Drinking Water and Wastewater Infrastructure, May 2002, http://www.cbo.gov/sites/default/files/cbofiles/ftpdocs/39xx/doc3983/11-18- watersystems.pdf; Water Infrastructure network, Clean and Safe Water for the 21st Century, April 2000, http://www.win-water. org/reports/winreport2000.pdf; and Anderson, Richard F., ph.d., U.S. Conference of mayors, mayors Water Council, Trends in Local Government Expenditures on Public Water and Wastewater Service and Infrastructure: Past, Present and Future, 2010, http://www.usmayors.org/publications/201002-mwc-trends.pdf. 7 See, for example, http://www.publicsectorinc.org/forum/. 8 American Water Works Association, Dawn of the Replacement Era: Reinvesting in Drinking Water Infrastructure, 2001. http:// www.win-water.org/reports/infrastructure.pdf. 9 Water Infrastructure Network News Release, “Groups Call for New Investment in America’s Water Infrastructure,” February 13, 2001. http://archive.nacwa.org/advocacy/winow.html. 10 Water Infrastructure network, Clean and Safe Water for the 21st Century, April 2002. http://www.win-water.org/reports/ winreport2000.pdf. 11 Utah State University Buried Structures Laboratory news Release, “pvC pipe Has Lowest Break Rate According to USU Researcher,” April 26, 2012. http://www.usu.edu/ust/index.cfm?article=51095. 12 Rajani, Balvant, Kleiner, Yehuda, and Krys, dennis, Long-Term Performance of Ductile Pipes, Water Research Foundation, 2011, p. xxi. http://www.waterrf.org/pages/projects.aspx?pId=3036. 13 Anderson, Richard F., ph.d., Municipal Procurement: Procurement Process Improvements Yield Cost-Effective Public Benefits, U.S. Conference of mayors, mayors Water Council, march 2013, p. 11. http://www.usmayors.org/publications/ media/2013/0422-waterprocurementWp.pdf. 14 Fitzgerald III, John, “Corrosion as a primary Cause of Cast-Iron main Breaks,” AWWA Journal, August 1968. http://www. awwa.org/publications/journal-awwa/abstract.aspx?articleid=29325268. 15 O’ Day, Kelly, “External Corrosion in Distribution Systems,” AWWA Journal, October 1989. http://www.awwa.org/publications/ journal-awwa/abstract.aspx?articleid=12313. 16 Folkman, S., Water Main Break Rates in the USA and Canada: A Comprehensive Study, Utah State University Buried Structures Laboratory, 2012. http://www.usu.edu/ust/index.cfm?article=51095. 17 Ibid. 18 Spickelmire, William, “Corrosion Control Considerations for Ductile Iron Pipe – A Consultant’s Perspective,” Materials Performance, 41(7):16 (2002). 22 national taxpayeRs union
19 Lary, Jim, “Corrosion, not Age, Is to Blame for most Water main Breaks,” WaterWorld, April 2000. http://www.waterworld. com/articles/print/volume-16/issue-4/editorial-focus/corrosion-not-age-is-to-blame-for-most-water-main-breaks.html. 20 gummow, Robert A., “the Corrosion of municipal Iron Watermains,” Materials Performance, March 1984. 21 gerhardus, H. Koch, ph.d., et al., Corrosion Cost and Preventive Strategies in the United States, U.S. Federal Highway Administration Report no. FHWA-Rd-O1-156, September 2001. http://www.nace.org/uploadedFiles/publications/ccsupp.pdf. 22 Anderson, Richard F., ph.d., Municipal Procurement: Procurement Process Improvements Yield Cost-Effective Public Benefits, U.S. Conference of Mayors, Mayors Water Council, March 2013, p. 9. http://www.usmayors.org/publications/ media/2013/0422-waterprocurementWp.pdf. 23 Cast Iron pipe Research Association, Handbook: Ductile Iron Pipe, Cast Iron Pipe, Fifth Edition, 1976. 24 See Romanoff, melvin, “exterior Corrosion of Cast-Iron pipe,” AWWA Journal, September 1964; http://www.awwa.org/ publications/journal-awwa/abstract.aspx?articleid=29324541; and Romanoff, Melvin, Results of National Bureau of Standards Corrosion Investigations in Disturbed and Undisturbed Soils, West Virginia University, Technical Bulletin No. 86, 1967. 25 gerhold, W.F., “Corrosion Behavior of ductile Cast-Iron pipe in Soil environments,” AWWA Journal, December 1976. http:// www.awwa.org/publications/journal-awwa/abstract.aspx?articleid=10214. 26 Bonds, Richard W., Barnard, Lyle m., Horton, A. michael, and Oliver, gene L., “Corrosion and Corrosion Control of Iron pipe: 75 Years of Research,” AWWA Journal, June 2005. http://www.awwa.org/publications/journal-awwa/abstract. aspx?articleid=15256. 27 Anderson, Richard F., ph.d., Municipal Procurement: Procurement Process Improvements Yield Cost-Effective Public Benefits, U.S. Conference of mayors, mayors Water Council, march 2013, p. 10. http://www.usmayors.org/publications/ media/2013/0422-waterprocurementWp.pdf. 28 Baird, gregory, “the epidemic of Corrosion, part 1: examining pipe Life,” AWWA Journal, december 2011. http://www. awwa.org/publications/journal-awwa/abstract.aspx?articleid=28486956. 29 Baird, gregory, “the Silver Bullet for Aging Water distribution Systems?” AWWA Journal, June 2011. http://www.awwa.org/ publications/journal-awwa/abstract.aspx?articleid=28058. 30 Ackerman, Frank, and massey, Rachael, The Economics of Phasing Out PVC, global development and environment Institute, tufts University, march 2003 (revised may 2006). http://www.ase.tufts.edu/gdae/pubs/rp/economics_of_pvC_ revised.pdf. 31 Spickelmire, William, “Corrosion Control Considerations for Ductile Iron Pipe – A Consultant’s Perspective,” Materials Performance, 41(7):16 (2002). 32 American Water Works Association, “Buried No Longer: Confronting America’s Water Infrastructure Challenge,” 2012. http:// www.awwa.org/Portals/0/files/legreg/documents/BuriedNoLonger.pdf. 33 Anderson, Richard F., ph.d., Municipal Procurement: Procurement Process Improvements Yield Cost-Effective Public Benefits, U.S. Conference of mayors, mayors Water Council, march 2013. http://www.usmayors.org/publications/ media/2013/0422-waterprocurementWp.pdf. 34 American Water Works Association, “Buried No Longer: Confronting America’s Water Infrastructure Challenge,” 2012. http:// www.awwa.org/Portals/0/files/legreg/documents/BuriedNoLonger.pdf. 35 Ibid. 36 new York State department on environmental Conservation, Wastewater Infrastructure Needs of New York State, march 2008. http://www.dec.ny.gov/docs/water_pdf/infrastructurerpt.pdf. 37 Anderson, Richard F., ph.d., Municipal Procurement: Procurement Process Improvements Yield Cost-Effective Public Benefits, U.S. Conference of mayors, mayors Water Council, march 2013, p. 15. http://www.usmayors.org/publications/ media/2013/0422-waterprocurementWp.pdf. 38 Ibid., p. 14. 39 Baird, Gregory, “Water Affordability: Who’s Going to Pick Up the Check?” AWWA Journal, december 2010. http://www.awwa. org/publications/journal-awwa/abstract.aspx?articleid=26092. RefoRming ouR nation’s appRoach to the infRastRuctuRe cRisis 23
appendix The uTiliTy yArdsTiCk: rATepAyers’ quesTions for eleCTed offiCiAls 1. does the utility have open and fair procurement policies? 2. Have these policies or design specifications been updated to include new materials or products? 3. What is the utility’s water loss; has a water audit been conducted? 4. What is the utility’s water main break rate by pipe type? 5. What are the causes of water main breaks given the pipe type, age, and diameter? 6. What is the pipe warranty? does the utility employ a pipe installation inspector? 7. In a wastewater environment, are non-corrosive pipes and polymer manholes used? 8. does the utility consider sustainability policies and life-cycle costs in the procurement process? 9. Are there any rates, fees, or charges which automatically increase? 10. Has an allocation study validated transfers from “enterprise funds” set aside for water infrastructure to the general fund? 11. Has a comprehensive cost-of-service study been conducted in the last 3 years? 12. Has every fee and charge been reviewed as to its accuracy in the last 3 years? 13. Are the current developer fee/connection charges tied to an approved master plan or approved capital improvement plan? 14. Does the current master plan reflect recent changes due to the downturn of the economy, changes in growth, conservation and revenue, delayed capital projects, etc.? 15. Does the utility have a current financial plan document that helps guide the financial model; if so, what are the key financial metrics? 16. does the utility use a computerized maintenance management system (CmmS) to schedule all work orders? 17. does the utility maintain an inventory of all assets that includes related attributes and condition assessments? 18. does the utility employ infrastructure asset management best practices for prioritizing capital projects based on an accepted system of “criticality scoring”? 19. What are the performance measures, key performance indicators, or service level goals that drive potential rate increases, and are they quantified in terms of costs and rate impact? 20. Does the utility use a 10-year financial model or capital plan? 21. does the utility track and forecast the affordability impacts of current and future rate increases for each major demographic group within the utility’s boundaries? 22. Has the utility conducted a peer review of its rate forecast and explored other alternative options to minimize increases? 23. Has the utility identified critical issues and conducted studies to provide mitigation options? 24. Has the utility posted information pertaining to capital improvement plans, master plans, mitigation studies, cost-of-service studies, allocation studies, asset management issues, fee structures, and other key documents of interest to ratepayers in an easy-to-understand format on the Internet? 25. Have elected officials been adequately trained in utility oversight and policy making? 24 national taxpayeRs union