Download
1 / 31
310 likes | 413 Views
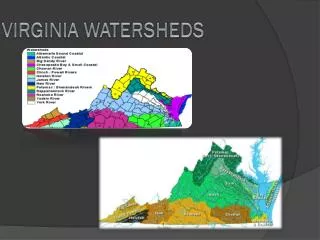
Clean Watersheds Needs Survey (CWNS) 2012 Gap Approach Option June 22, 2010. Overview. Introduction to the Wastewater Infrastructure “Gap” Approach Gap Approach in Pennsylvania’s 2008 Governor’s Sustainable Infrastructure Report Gap Approach Option in CWNS 2012

E N D
Clean Watersheds Needs Survey (CWNS) 2012Gap Approach OptionJune 22, 2010
Overview • Introduction to the Wastewater Infrastructure “Gap” Approach • Gap Approach in Pennsylvania’s 2008 Governor’s Sustainable Infrastructure Report • Gap Approach Option in CWNS 2012 • Sample State CWNS Gap Data Collection Form • Mock CWNS Data Entry Portal modifications for Gap Approach • Appendix – CWNS Categories
Introduction to the Wastewater Infrastructure Gap Approach
What do we mean by Wastewater Infrastructure “Gap?” Wastewater Infrastructure Treatment Plants, Pump Stations, Pipes Gap Total 20-Year Needs (capital, O&M, debt service) Projected 20-Year Revenues = 20-Year Gap
How is gap calculated? It is calculated on a facility- or system-basis for a given year. Gap for that facility or system can then be totaled for a 20-year period. By extrapolating from a sample set of systems, the Gap for all facilities and systems in a state can then be estimated.
2) Gap Approach in Pennsylvania 2008 Governor’s Sustainable Infrastructure Report
Pennsylvania’s 2008 Governor’sSustainable Infrastructure Report PA collected data from sampled facilities Condition and Replacement Costs of Facility Assets (Pipes, Treatment Plant Unit Processes,…) Current and Projected O&M and Capital Costs Existing Debt Service Current and Projected Revenues Asset Management Practices
Funding the Needs in Pennsylvania The Governor’s Report found a total 20-year water and wastewater infrastructure funding gap of $43.8 B ($28.3B of that was wastewater) Total available funding (grants plus cash-value of low-interest loans) was $2.1 B Complete Report at: http://www.portal.state.pa.us/portal/server.pt/community/sustainable_water_infrastructure_task_force/10565
Chart from Governor’s Report 9 MHI = Median Household Income
Governor’s Report data used for statewide policy decisions… Statewide information on where subsidy dollars should go to make the greatest difference Data to support recommendations for legislative or regulatory change Promote better management (Asset Management) and Full Cost Pricing
Pennsylvania can do Gap Approach to CWNS 2012 with same resources as Traditional Method Spend more time on each system involved, but do a sample rather than document the needs in all systems CWNS 2012 Gap Approach data elements are significantly fewer than PA Gap data elements Data collection form and CWNS DEP will allow data collection w/o site visits to many systems Less documentation requirements than Traditional Method
CWNS 2012 Gap Approach Option For Wastewater Treatment Plants & Sewer Systems: • Switch to Sample Survey • Collect more detailed data per facility • documented & asset condition based capital needs • O&M costs • revenues For Stormwater, Decentralized Systems, NPS Projects: Use the Traditional Documentation Methods and census approach
CWNS 2012 Gap Approach Option EPA would provide randomly sampled selections of facilities for each State Except for large facilities, a facility sampled in one survey would be exempt from samples in the next survey Sample designed for estimating State needs to within 25% of true value at 95% confidence level
CWNS 2012 Gap Approach Option Average sampling rates • Small Facilities (Pop<10k): 10 - 25% • Medium Facilities (Pop:10k-100k): 30 - 60% • Top 3% Facilities: 100%
CWNS 2012 Gap Approach Option Level of Effort EstimatesBased on PA’s Gap Approach Experience
The Gap Approach Option in the 2012 Report to Congress Capital needs component of States’ Gap totals – extrapolated to account for all systems in these States - will be included in the “Official Needs” section in the CWNS 2012 Report to Congress Entire suite of States’ Gap data would be summarized in a new Gap Analysis section of the CWNS 2012 Report to Congress
CWNS 2012 Gap Approach OptionPros & Cons to States ProsCons Provides complete State-level Does not support watershed assessment of Needs, & other sub-State area Revenues, Gaps displays & analyses that require census CWNS data Encourages surveyed facilities Potential Mitigation: For State to perform asset management uses only (not for inclusion and other comprehensive in the Report to Congress) assessments & management States could continue to techniques collect & enter into CWNS “traditional” CWNS data for all non-Gap sampled facilities
5) Mock CWNS Data Entry Portal modifications for Gap Approach
Gap Analysis Data Areas not Requiring DEP changes Location Flow Discharge Effluent Needs by Documents Capital Cost
Allows a federal user to set and unset GAP facilities Indicates Gap facility 22 Allows searching Gap facilities
Indicates Gap Facility Year and first month of local fiscal year 23
Volume of demand exceeds design capacity 1. Capacity Growth, system expansion Consumption of asset reduces performance below an acceptable minimum level Physical deterioration due to age, usage (including operator error), acts of nature 3. Mortality Performs ok, but cost of operation exceeds that of feasible alternatives 4. Efficiency “Pay-back” period Asset Failure Modes Mode Definition Tactical Aspects Codes/permits: NPDES, CSOs, SSOs, OSHA, noise, odor, life safety; service, etc 2. Level of Service Functional requirements exceed design capability
By default facility address zip code is populated. Lookup will allow selection of other service areas zip codes Calculated using zip code(s) Revenue & expenses is a sub tab under Needs tab Future year values for 20 years will be auto-populated based on year 1 and using escalation factors from Department of Labor and other sources. Auto-populated values can be updated. If the auto-populated values are updated the future values will be re-calculated accordingly. 28
For More Information, ContactMichael Plastinocwns@epa.gov202-564-0682
6) Appendix CWNS Categories