Download
1 / 22
220 likes | 380 Views
Compliance Perceptions Survey Results from the survey with individuals 2008-10. International Tax Conference - 1 December 2011. Kate Fox Eleanor Barham. Presentation Outline. Overview of the CPS Methodology of Individuals Survey Results from the Individuals Survey 2008-10

E N D
Compliance Perceptions SurveyResults from the survey with individuals 2008-10 International Tax Conference - 1 December 2011 Kate Fox Eleanor Barham
Presentation Outline • Overview of the CPS • Methodology of Individuals Survey • Results from the Individuals Survey 2008-10 • Focus on compliance • The Future of the CPS
Compliance Perceptions Survey (CPS) • Measures taxpayers’ perceptions of compliance • fairness and burden of compliance • the prevalence and acceptability of evasion • the possible consequences where evasion is detected Can be used to • further HMRC’s understanding of the drivers of compliance • add to evidence base to monitor the impact of policy changes • provide data on attitudes and beliefs Recognised as good practice by the OECD
Outline of CPS • The CPS comprises of two surveys: • Individuals • Small and Medium Enterprises (SME)
Methodology (1) • Office for National Statistics (ONS) Opinions Survey (formerly Omnibus Survey) • Stratified, random probability sample • 1 person per household interviewed face to face • Coverage: Great Britain CPS modules
Methodology (2) • CPS Questions • Cognitively tested by Personal Finance Research Centre (Bristol University) • Interview length - approximately 8 minutes • ONS Weighting • Reported percentages are weighted (to correct for unequal probability of selection and non-response). • Weights also gross up data (by age, sex and region to the population control totals used on the Labour Force Survey) • Unweighted data for statistical significance
Example Research Questions • Does the perception that tax rates are unfair lead to a view that evasion is acceptable? • 2. Does the perception that HMRC is unfair lead to a view that evasion is acceptable? • 3. Does the perception that evasion is prevalent lead to a view that evasion is acceptable? • 4. Are perceptions about sanctions for evasion related to perceived acceptability of evasion?
Key Findings of Survey with Individuals • Most individuals say income tax evasion is unacceptable • A large proportion of individuals think income tax evasion is prevalent • There are mixed opinions about the probability of detection and the role played by sanctions
Results from CPS of Individuals • Acceptability and Prevalence of Evasion • Perceived Likelihood of Detection for Evasion • Perceptions of the Sanctions for Evasion • Research Questions • All questions refer to income tax • Variation over time and between groups is presented where there is evidence of a statistically significant difference
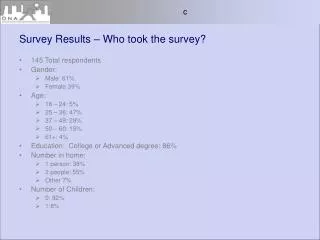
Acceptability of Evasion 2010 • Perceptions of acceptability • 88% said evasion is unacceptable or mostly unacceptable • 7% said evasion is acceptable or mostly acceptable • Need, amount taken and frequency made evasion more or less acceptable
Prevalence of Income Tax Evasion 2008-10 Prevalence Question: In your view, do you think that income tax evasion is... • Extent of income tax evasion • Most individuals say it is a major or moderate problem • Proportion of individuals who say it is a major problem has increased since 2008 • Similar proportions each year say evasion is a minor problem or not a problem
Likelihood of Being Caught 2010 • Regular evaders will be caught • Similar proportions of individuals say it is likely and unlikely that evaders will be caught (45% vs. 48%) • Similar proportions of people say it is likely and unlikely that they personally will be caught for not declaring cash income (48% vs. 44%) • Relationship between perceived likelihood of detection for self and others.
HMRC and Detection 2008-10 • Perceived likelihood HMRC will catch evaders compared to previous year • In 2010, 36% of individuals said it was more likely that HMRC would detect evasion compared to 2009. • 10% said detection was less likely and 40% said it was about the same. • Stabilising of perceptions of HMRC activity since 2008
Financial Penalties and Deterrence 2010 • Financial penalties are sufficient to deter potential evaders • Similar proportions of individuals agree and disagree that financial penalties are sufficient deterrents (28% vs. 30%) • 23% of individuals do not know whether the penalties are sufficient deterrents • More self employed people agree the penalties are sufficient deterrents than employees (26% vs. 39%)
Other Penalties for Evasion 2010 • 76% of individuals could name consequences other than financial penalties if caught for evasion • Most commonly mentioned reasons related to criminal prosecutions • Next cluster of penalties relate to social consequences • Also perceived negative impact on personal economic capability
Fairness by Acceptability 2010 • Whether or not individual agrees income tax is fair is not associated with the perceived acceptability of evasion • Weak association between individuals’ perception of HMRC and the acceptability of evasion • 5% of individuals who disagree HMRC treats them fairly say evasion is acceptable compared to 18% of those who feel that HMRC treats them fairly
Prevalence by Acceptability of Evasion 2010 • Weak association between the perceived prevalence and acceptability of evasion • 6% of individuals who think evasion is a major problem say evasion is acceptable • 24% of individuals who think evasion is not a problem say evasion is acceptable
Financial Penalties and Acceptability of Evasion 2010 • Whether financial penalties are sufficient to deter evasion is not associated with acceptability of evasion
Future of the CPS • Questionnaire changes • Revised question wording & new questions added on: tax evasion, misperceived social norms, proportionality and criminal sanctions • Survey of Individuals • One full module, more self employed booster modules per year Potential follow up research • Surveys with particular sub-groups (e.g. those aware of criminal prosecutions/ related press activity) • Evaluation of HMRC compliance campaigns • Qualitative research
Summary • Background to HMRC’s Compliance Perceptions Survey • Methodology for survey of individuals • Selected findings • Future direction of the CPS
Thank you HM Revenue & Customs Bush House South West Wing Strand WC2B 4RD katherine.fox@hmrc.gsi.gov.uk eleanor.barham@hmrc.gsi.gov.uk