Download

1 / 23
240 likes | 366 Views
Box and Whiskers Plot. By: Mr. Menjivar. 09/27/11. 09/27/11. Observe, Question, Comment . Box-and-Whiskers Plot. Box-and-Whiskers Plot Reflection. Warm-Up:. 16L. 16R. Brain Stimulation. Brain Stimulation. Lesson 12-3 ‘Check Skills You’ll Need’ Median is 9.5 Median is 4.9

E N D
Box and Whiskers Plot By: Mr. Menjivar
09/27/11 09/27/11 Observe, Question, Comment Box-and-Whiskers Plot Box-and-Whiskers Plot Reflection Warm-Up: 16L 16R
Brain Stimulation • Lesson 12-3 ‘Check Skills You’ll Need’ • Median is 9.5 • Median is 4.9 • Median is 52 • Median is 101
09/27/11 09/27/11 Observe, Question, Comment Box-and-Whiskers Plot Box-and-Whiskers Plot Reflection Warm-Up: Standard: 16L 16R
CA Content Standards Statistics Data Analysis and Probability 1.1: Know various forms of display for data sets Statistics Data Analysis and Probability 1.3: Understanding the meaning of, and be able to compute, the median of a data set
09/27/11 09/27/11 Observe, Question, Comment Box-and-Whiskers Plot Box-and-Whiskers Plot Reflection Warm-Up: Standard: Objective: 16L 16R
Objective: • To make box-and-whisker plots • To analyze data in box-and-whisker plots
09/27/11 09/27/11 Observe, Question, Comment Box-and-Whiskers Plot Box-and-Whiskers Plot Reflection Warm-Up: Standard: Objective: Vocabulary: 16L 16R
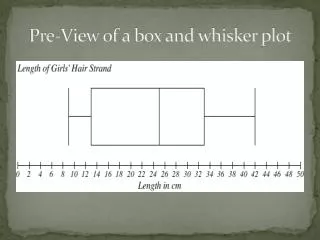
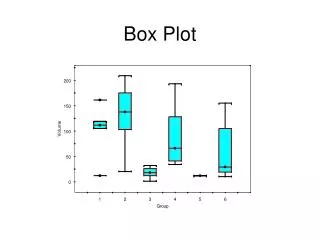
Vocabulary:Box-and-Whisker Plot The graph displays the distribution of data items along a number line
Vocabulary:Quartiles They divide the data into four equal parts. (Note: the median is the middle quartile)
09/27/11 09/27/11 Observe, Question, Comment Box-and-Whiskers Plot Box-and-Whiskers Plot Reflection Warm-Up: Standard: Objective: Vocabulary: Notes/Examples: 16L 16R
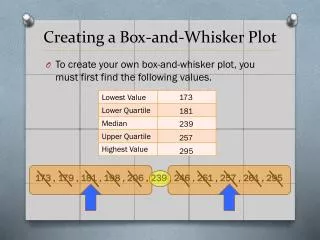
Box-and-Whisker Plot Summary • Minimum means Lowest Value • Lower Quartile means median of lower half • Median • Upper Quartile means median of upper half • Maximum means Greatest Value
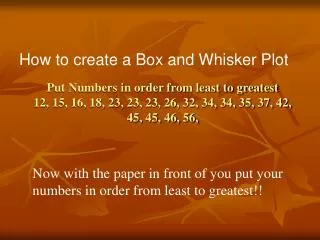
First • Put the data in order from least to greatest • Find the median • Find the median of the lower half which is the lower quartile (LQ). • Find the median of the upper half which is the upper quartile (UQ).
Second • Graph the median on the number line. • Graph the quartiles on the number line. • Graph the minimum and maximum.(biggest and smallest value.)
Third • Draw a box around the quartiles • Draw a vertical line at the median.
Fourth • Draw a line from the quartiles to the minimum and maximum
Example 1 • Draw a box-and-whisker plot for the distances of migration of birds. (thousands of miles) 5, 2.5, 6, 8, 9, 2, 1, 4, 6.5, 18, 7
Example 2 • The data below represent the wingspans in centimeters of captured birds. Make a box-and-whiskers plot. 61, 35, 61, 22, 33, 29, 40, 62, 21, 49, 72, 75, 28, 21, 54
Example 3 • Make a box-and-whiskers plot. 1, 1, 3, 3, 4, 5, 7, 7, 8, 9, 9.
09/27/11 09/27/11 Observe, Question, Comment Box-and-Whiskers Plot Box-and-Whiskers Plot Reflection Warm-Up: Standard: Objective: Independent Practice: Vocabulary: Notes/Examples: 16L 16R
Homework • Student Workbook, pg. 485, #’s 1-7 [Due: Next Meeting]