Download
1 / 12
120 likes | 253 Views
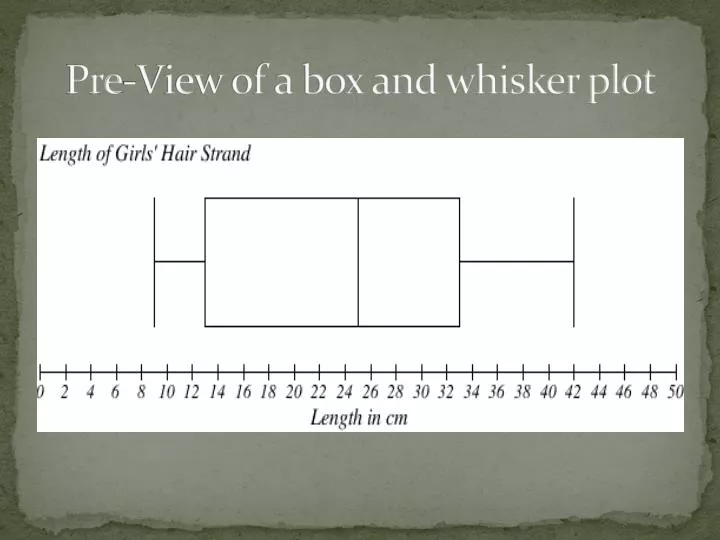
Pre-View of a box and whisker plot . Pre-View of a box and whisker plot . What is the scale and interval of the number line below the plot? Are you able to tell how many parts the data set is divided into?

E N D
Pre-View of a box and whisker plot • What is the scale and interval of the number line below the plot? • Are you able to tell how many parts the data set is divided into? • What do you think the far right and far left points represent (at the end of the whiskers)? • What do you think the line inside the box represents?
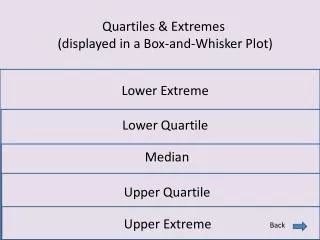
Pre-View of a box and whisker plot • Where do you think the following labels should go on our box and whisker plot? • Upper extreme, Lower extreme, second (lower) quartile, third (upper) quartile, interquartile range, and median.
A Box and Whisker plot Uses a number line to show the distribution of a set of data. It divides a set of data into four parts using the median and quartiles. A box is drawn around the quartile values, and whiskers extend from each quartile to the minimum and maximum values that are not outliers.
Key Features of a box plot • Quartiles • The median is the middle quartile • The median of the lower half of the data is the lower quartile. • The median of the upper half of the data is the upper quartile • The lower extreme forms the lower whisker. • The upper extreme forms the upper whisker. • Interquartile Range (IQR) is the difference between the upper quartile and the lower quartile
Outliers – data more than 1.5 times the value of the interquartile range beyond the quartiles • Step 1: Find the median, lower quartile, and upper quartile. • Step 2: Find the interquartile range. • Step 3: Multiply the interquartile range by 1.5. • Step 4: Subtract the value from the lower quartile and add the value to the upper quartile.
Find any outliers in the data set. Animal Speeds Glencoe Pre-Algebra (2012) pg. 793 • Step 1: median - 30 lower quartile - 15 upper quartile - 35 • Step 2: interquartile range 35 – 15 = 20 • Step 3: IQR x 1.5 20 x 1.5 = 30 • Step 4: lower quartile – 30 15 – 30 = -15 upper quartile + 30 35 + 30 = 65 70 is an outlier
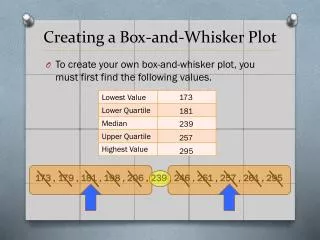
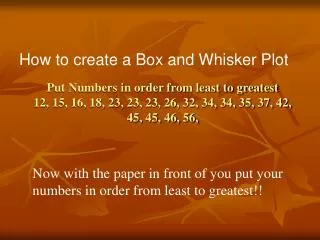
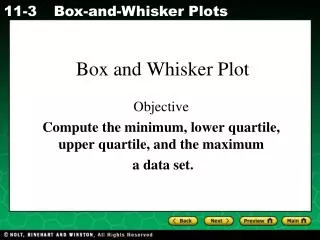
Steps to creating a box plot • 1. Organize the data from smallest to largest. • 2. Identify the lower extreme, lower quartile, median, upper quartile, upper extreme. • 3. Find the interquartile range. • 4. Identify any outliers, use an asterisk(*) to indicate an outlier. It is not connected to a whisker. • 5. Draw the number line, mark the scale, and label the scale. • 6. Draw the box plot. • 7. Give the box plot a title.
Pre-View of a box and whisker plot • Write 3-5 sentences summarizing the data displayed.
Key Ideas • The shortest hair measured was 9 cm. • The lower quartile is 13 cm. • The median is 25 cm. • The upper quartile is 33 cm. • The longest hair measured was 42 cm. • The range is 42 cm – 9 cm or 33 cm. • The interquartile range is 33 cm -13 cm = 20 cm • The middle half of the data lies between 33 and 13. So the middle half of the girls measured had hair between 33cm and 13 cm. This is more variability in the lower half of the data indicating that more girls had hair lower than 25 cm than had hair longer than 25 cm.
Limitations of a box and whisker plot • The box plot provides a summary of the data. It does not show the number of observations (so you can’t find the mean) nor does it indicate if a particular value was especially common (so you can’t find the mode).
Higher –Order Thinking Skills • 1. The range is always, sometimes, or never affected by outliers. Justify your reasoning. • 2. True or false. The interquartile range is affected by outliers of the data set. Explain your reasoning. • 3. It is always, sometimes, or never possible for the mean, median, and mode to be equal? Justify your reasoning. • 4. Can a data set have more than one median? Explain. Glencoe Pre-Algebra (2012) pg. 778 and 796