Download
1 / 19
201 likes | 413 Views
Box and Whisker Plot. Objective Compute the minimum, lower quartile, upper quartile, and the maximum a data set. Steps. 1. Numerical Order 2. Find the median 3. Find Lower Quartile (left median) 4. Find Upper Quartile (right median) 5. Draw number line

E N D
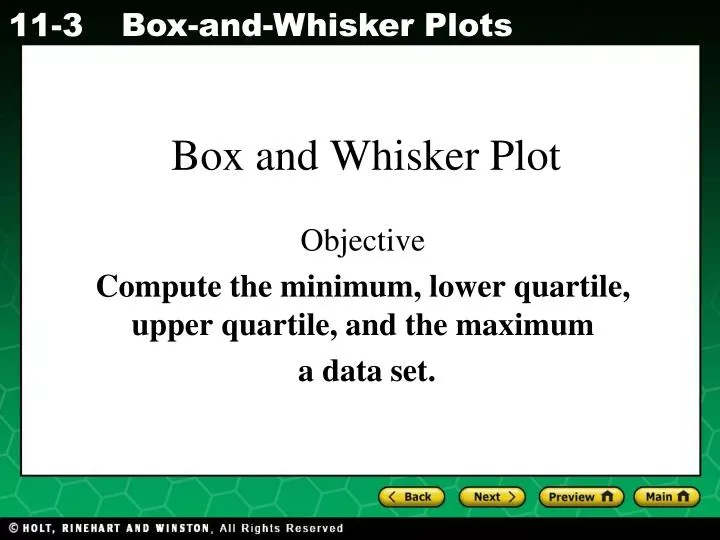
Box and Whisker Plot Objective Compute the minimum, lower quartile, upper quartile, and the maximum a data set.
Steps • 1. Numerical Order • 2. Find the median • 3. Find Lower Quartile (left median) • 4. Find Upper Quartile (right median) • 5. Draw number line • 6. Plot Lower & Upper Quartile, Median, Minimum & Maximum
Order numbers 3, 5, 4, 2, 1, 6, 8, 11, 14, 13, 6, 9, 10, 7 • First, order your numbers from least to greatest: 1, 2, 3, 4, 5, 6, 6, 7, 8, 9, 10, 11, 13, 14
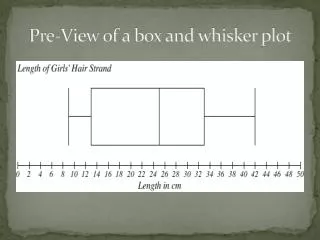
Median = Lower Quartile = Upper Quartile = Minimum = Maximum = 1 2 3 4 5 6 7 8 9 10 11 12 13 14
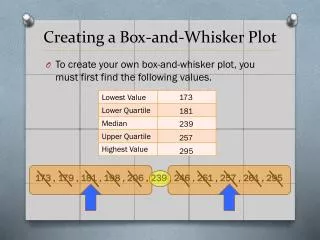
15 + 17 2 21 + 21 2 upper quartile: = 21 lower quartile: = 16 19 + 19 2 median: = 19 Additional Example 2: Making a Box-and-Whisker Plot Use the given data to make a box-and-whisker plot. 21, 25, 15, 13, 17, 19, 19, 21 Step 1. Order the data from least to greatest. Then find the minimum, lower quartile, median, upper quartile, and maximum. 13 15 17 19 19 21 21 25 minimum: 13 maximum: 25
12 14 16 18 20 22 24 26 28 Additional Example 2 Continued Use the given data to make a box-and-whisker plot. Step 2. Draw a number line and plot a point above each value from Step 1. 13 15 17 19 19 21 21 25
12 14 16 18 20 22 24 26 28 Additional Example 2 Continued Use the given data to make a box-and-whisker plot. Step 3. Draw the box and whiskers. 13 15 17 19 19 21 21 25
31 + 33 2 24 + 26 2 upper quartile: = 32 lower quartile: = 25 29 + 31 2 median: = 30 Check It Out! Example 2 Use the given data to make a box-and-whisker plot. 31, 23, 33, 35, 26, 24, 31, 29 Step 1. Order the data from least to greatest. Then find the minimum, lower quartile, median, upper quartile, and maximum. 23 24 26 29 31 31 33 35 minimum: 23 maximum: 35
22 24 26 28 30 32 34 36 38 Check It Out! Example 2 Continued Use the given data to make a box-and-whisker plot. Step 2. Draw a number line and plot a point above each value. 23 24 26 29 31 31 33 35
22 24 26 28 30 32 34 36 38 Check It Out! Example 2 Continued Use the given data to make a box-and-whisker plot. Step 3. Draw the box and whiskers. Step 2. Draw a number line and plot a point above each value. 23 24 26 29 31 31 33 35
Additional Example 3: Comparing Data Sets Using Box-and-Whisker Plots These box-and-whisker plots compare the ages of the first ten U.S. presidents with the ages of the last ten presidents (through George W. Bush) when they took office.
Additional Example 3 Continued A. Compare the medians and ranges. The median for the first ten presidents is slightly greater. The range for the last ten presidents is greater.
Additional Example 3 Continued B. Compare the ranges of the middle half of the data for each. The range of the middle half of the data is greater for the last ten presidents.
Oakland 0 3 6 9 12 15 18 Tampa Bay 0 3 6 9 12 15 18 Check It Out! Example 3 These box-and-whisker plots compare the point per quarter at Super Bowl XXXVII.
Oakland 0 3 6 9 12 15 18 Tampa Bay 0 3 6 9 12 15 18 Check It Out! Example 3A A. Compare the medians and ranges. The median for Tampa Bay is significantly greater and the range for Tampa Bay is slightly greater.
Oakland 0 3 6 9 12 15 18 Tampa Bay 0 3 6 9 12 15 18 Check It Out! Example 3B B. Compare the ranges of the middle half of the data for each. The range of the middle half of the data is greater for Tampa Bay.
Lesson Quiz: Part I Find the lower and upper quartiles for each data set. 1. 48, 52, 68, 32, 53, 47, 51 2. 3, 18, 11, 2, 7, 5, 9, 6, 13, 1, 17, 8, 0 lower = 47; upper = 53 lower = 2.5; upper = 12
78 87 91 94 98 Lesson Quiz: Part II Use the following data for problems 3 and 4. 91, 87, 98, 93, 89, 78, 94 3. Make a box-and-whisker plot. 4. What is the median and range of the data? 91; 20