Download
1 / 18
180 likes | 276 Views
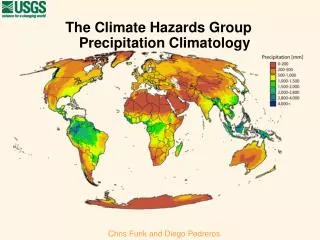
Development of Bias-Corrected Precipitation Database and Climatology for the Arctic Regions. Daqing Yang, Principal Investigator Douglas L. Kane, Co-Investigator Institute of Northern Engineering University of Alaska Fairbanks David R. Legates, Co-Investigator Center for Climatic Research

E N D
Development of Bias-Corrected Precipitation Database and Climatology for the Arctic Regions Daqing Yang, Principal Investigator Douglas L. Kane, Co-Investigator Institute of Northern Engineering University of Alaska Fairbanks David R. Legates, Co-Investigator Center for Climatic Research Department of Geography University of Delaware
Outline • Background /Goals • Methods • - Results and applications of WMO gauge intercomparison project • Data Sources • Major Tasks • Results/Products/Impacts
Uncertainties of Precipitation Records and Climatology in the Arctic regions • Sparseness of the precipitation observation networks; • Uneven distribution of measurement sites, i.e. biased toward coastal and the low-elevation areas; • Spatial and temporal discontinuities of precipitation measurements induced by changes in observation methods and by different observation techniques used across national borders; and • Biases of gauge measurements, such as wind-induced undercatch, wetting and evaporation losses, and underestimate of trace amount of precipitation.
Research Goals • Evaluate and define the accuracy of precipitation measurements in the Arctic regions. • Implement the consistent bias-correction methods over the pan-Arctic, i.e. Alaska, northern Canada, Siberia, northern Europe, Greenland, and the Arctic Ocean. • Develop biased-corrected and compatible precipitation database (including grid products) and climatology for the Arctic regions as a whole.
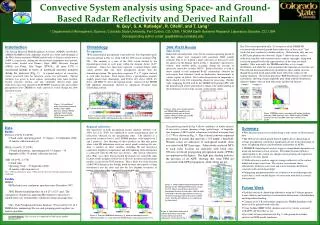
US Wyoming snow system in Barrow, AK WMO double fence intercomparison reference (DFIR) in Barrow, AK
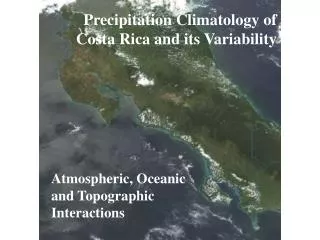
Overall mean for the NP drifting stations, 1957-90 (Yang, 1999) Overall mean for 61 climate stations in Siberia, 1986-92 (Yang and Ohata, 2001)
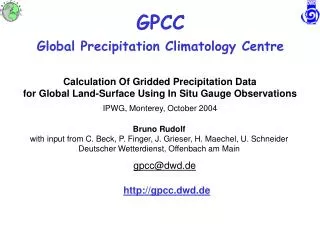
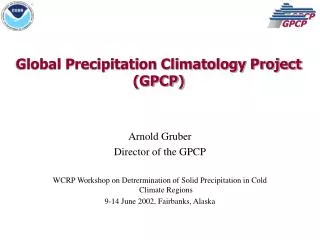
Data Sources Daily precipitation, temperature and wind speed are needed for this research. • National Climatic Data Center (NCDC), global daily surface data archive (1994-present) for over 8,000 stations around the world, http://www.ncdc.noaa.gov/cgi-bin/res40.pl • WMO GTS, the Global Climate Observing System (GCOS) Surface Network (GSN), http://www.wmo.ch/web/gcos/gcoshome.htlm • Arctic Precipitation Data Archive (APDA) at the Global Precipitation Data Center (GPDC), http://www.dwd.de/research/gpcc/acsys
Arctic Ocean (6 hourly and daily) met data collected at the Russian NP drifting station, National Snow and Ice Data Center (NSIDC) http://www-nsidc.colorado.edu/index.html Station and gauge info: • type of precipitation gauge • height of gauge and wind sensor • wind shield WMO and national weather services: • USA, Canada • Russia, Finland, Denmark, ...
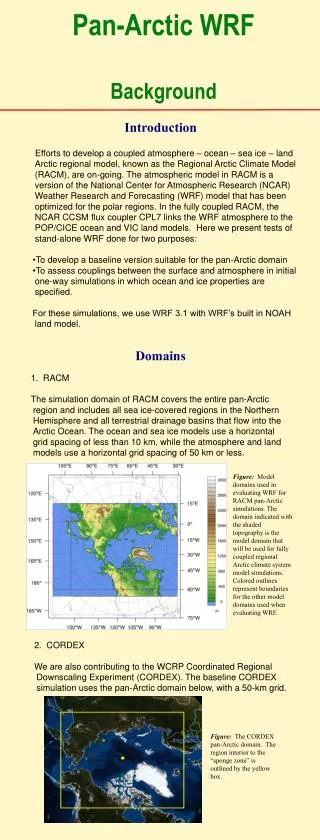
Synoptic/climate stations on land above 45N and the Arctic Ocean drifting stations will be used for this research
Major Task 1: Evaluation and Implementation of the WMO Bias Correction Methods - threshold wind 6.5m/s • Analysis of wind regimes over the arctic regions • Focus on winter season and on snowfall days • Define regions where the WMO bias correction methods may not be appropriate and therefore alternative approaches or further experimental studies should be considered
Major Task 2: Development of Bias-Corrected Arctic Precipitation Database and Climatology • Implement the WMO methods to all the stations in the Arctic regions for last 30 years, 1970-2000??? • Create bias-corrected daily precipitation dataset- an important basis for analyses of Arctic regional precipitation, i.e. long-term mean, seasonal cycle, year-to-year variation, and trend
Develop improved precipitation climatology for the Arctic regions • Consider terrain and the orographic effect on precipitation distribution, use high-resolution digital elevation models (DEM) to determine elevation, slope, and aspect of the topography • Apply PRISM (Daly et al., 1994) and the High-Resolution Weather Data System (HRWxDS) (Legates et al,. 1999) to generate regional maps of monthly/yearly bias-corrected precipitation • Develop gridded precipitation data, use equal-area EASE grid system, compatible with ACSYS/Arctic Precipitation Data Archive (APDA), hydrological model intercomparison project, and RS snowcover (SCE/SWE) products
Major Task 3: Comparison and Validation of the Results • Compare our results with other precipitation datasets/products, such as Legates and Willmott (1990),Jaeger (1983), UNESCO (1978),Adam and Lettenmaier (2003), and others? • Compare gauge measurements/corrections with snowcover accumulation in selected regions/basins • Assess the impact of precipitation bias corrections to regional hydrologic model analyses (Zhang et al., 2000) • Compare GCM/RCM precipitation simulation with the observed and bias-corrected precipitation fields in selected regions, i.e. Alaska and central Siberia • model simulation agrees better to bias-corrected precipitation fields particularly in winter months and over windy areas !?
Results/Products/Impacts • Practical procedures for correcting gauge-measured precipitation data in the high latitude regions • Bias-corrected daily/monthly/yearly (station) precipitation records/correction factors (CF, %) for arctic regions across national boundaries • Bias-corrected, gridded monthly/yearly regional precipitation data/climatology for the arctic regions • Impacts: • water balance calculations of both the Arctic Ocean and terrestrial systems • climate change analysis and hydrologic modeling • validation of GCM/RCM simulations • calibration of remote sensing data/products