Download
1 / 21
220 likes | 381 Views
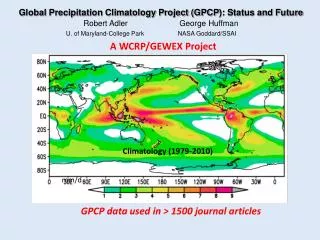
The Climate Hazards Group Precipitation Climatology. Chris Funk and Diego Pedreros. CHG rainfall estimation Process. Climate Hazards Group Climatology [mm]. Climate Hazards group InfraRed Precipitation (CHIRP) [mm]. Mean Spatial Variations. X. Temporal Variations.

E N D
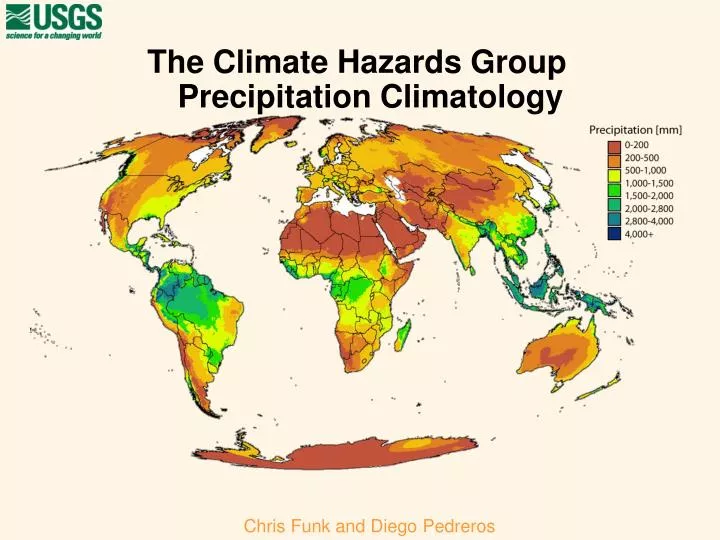
The Climate Hazards Group Precipitation Climatology Chris Funk and Diego Pedreros
CHG rainfall estimation Process Climate Hazards Group Climatology [mm] Climate Hazards group InfraRed Precipitation (CHIRP) [mm] Mean Spatial Variations X Temporal Variations Cold Cloud Duration Precipitation Anomalies [%]
Outline • Goal – The CHG Precipitation Climatology • Data • Station Data • Physiographic predictors • Satellite Mean Fields • Method • Local correlations • Moving window regressions • Validation Results
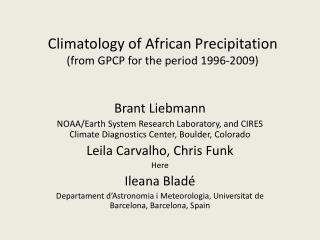
CHG Station Database 1st – compile station data both historical and current CHG climatology based on UN Food and Agriculture Organization (FAO) and Global Historical Climate Network (GHCN) precipitation normals, 1980-2009 baseline.
Potential Predictors • Physiographic Predictors • Latitude, Longitude, Digital Elevation Model, Slope • Satellite mean fields • CMORPH mean precipitation • Tropical Rainfall Monitoring Mission (TRMM) mean precipitation • MODIS mean Land Surface Temperatures • Global, 0.05° resolution, Monthly
Definition: Local Correlation • The CHG climatology estimation process builds on the idea of local correlation • A local correlation • Only uses nearby points • Weights the nearest points most stations with positive relationship to latitude stations with negative relationship to latitude Latitude
Definition: Local Correlation stations with positive relationship to elevation stations with negative relationship to elevation Latitude
Examples: Local Correlation Local correlations with July station means. A. Elevation B. Combined TRMM/CMORPH precipitation.
Estimate value for a pixel Estimated rainfall value for each pixel Moving Window Regressions Select predictors Define region Radius=150km Satellite rainfall Latitude elevation Define a window of interest, good spatial coverage with stations and similar topography. Select best predictors for the region of interest. Search for available stations within a radius (1.5 to 5 degrees). Extract value of predictors at each station location. Create a simple linear model for each circle. Ye = b0 +b1*x1 + … +bn *xn
Adding Interpolated Residuals • After building a linear regression estimate at each pixel: Ye = b0 +b1*x1 + … +bn *xn • Calculate the residual at each station: r=Ye-Y • And interpolate the residuals using inverse distance weight based interpolation • The final …. CHGPclim = Ye + Interpolated(r)
Cross-validation statistics • Remove 10% of stations • Estimate MFR and Interpolated(r) • Calculate Errors • Repeat
Validation Studies • Based on independent validation data sets from developing countries • Afghanistan, Sahel, Ethiopia, Colombia, Mexico • CHPclim compared with ‘flagship’ global climatologies • University of East Anglia’s Climate Research Unit (CRU) • Worldclim
Summary • CHPclim based on moving window regressions blending satellite mean fields with elevation, latitude and longitude • CHPclim also uses interpolated station residuals • Cross-validation suggests errors of about 20% of the mean • CHPclim compares well with ‘flagship’ global climatologies: the University of East Anglia’s Climate Research Unit (CRU) and Worldclim