Download
1 / 53
540 likes | 651 Views
Students / Postdocs Neil Kumar Alejandro Wolf-Yadlin Hyung-Do Kim Dr. Yi Zhang Dr. Sampsa Hautaniemi Dr. Brian Joughin Kristen Naegle. Phospho-Proteomic Analysis of Signaling Networks Governing Cell Functions. Collaborators Prof. Forest White Prof. Michael Yaffe Dr. Steve Wiley (PNNL).

E N D
Students / Postdocs Neil Kumar Alejandro Wolf-Yadlin Hyung-Do Kim Dr. Yi Zhang Dr. Sampsa Hautaniemi Dr. Brian Joughin Kristen Naegle Phospho-Proteomic Analysis of Signaling Networks Governing Cell Functions Collaborators Prof. Forest White Prof. Michael Yaffe Dr. Steve Wiley (PNNL) NCI Integrative Cancer Biology Program AstraZeneca
Focus on Dynamic Protein Operations to understand how Cell Phenotypic Behaviors arise from Genome/Environment Convolution cell / tissue phenotypic behavior environmental context (e.g., growth factors, cytokines, extracellular matrix factors, mechanical forces, etc.) dynamic protein operations mRNA expression genome protein levels
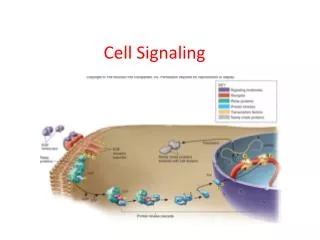
Multi-Variate, Quantitative Protein-Centric Measurement -- Protein Levels, States, Activities, Locations, Interactions… WBs, FACS, mass spectrometry * Multi-well kinase activity assays Protein microarrays Fluorescence microscopy
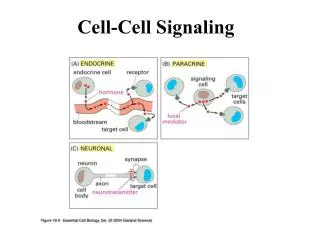
Question: Can We Understand How Cell Signaling Networks Integratively Process Information to Govern Phenotypic Responses? ‘response’ (phenotype) ‘cues’ ‘signals’ [‘execution’-- transcription, metabolism, cytoskeleton]
Premise: Cell Behavior is Governed by Multivariate Network State Thus, Seek Multivariate ‘Signal-Response’ Relationships -- which represent cellular “information processing algorithms”
Example Problem in Cancer Biology: Dysregulation of ErbB System in Epithelial Cells Yarden & Slikowski, Nat Rev Mol Cell Biol (2001)]
HER2: “Promiscuous Partner” in ErbB Family -- despite having no known ligand Yarden & Slikowski, Nat Rev Mol Cell Biol (2001)]
HER2 Over- Expression in Breast Cancer via gene amplification -- enhanced tumor invasiveness Anti-HER2 MAb Herceptin -- effective in only a portion of HER2-overexpressing patients
Activation of HER2 by EGF/EGFR or HRG/HER3 -- ligands may be autocrine in source Yarden & Slikowski, Nat Rev Mol Cell Biol (2001)]
Experimental Model System for Investigation of HER2 Overexpression Effects: 184A1 Human Mammary Epithelial Cells (HMECs) 24H (High EGFR & HER2) Parental (High EGFR) EGFR: HER2: HER3: 200,000 20,000 20,000 200,000 600,000 30,000 EGF: EGFR Binding -- EGFR/EGFR and EGFR/HER2 signaling HRG: HER3 Binding -- HER3/HER2 signaling
Effects of HER2 Overexpression on HMEC Migration and Proliferation In response to EGF and HRG
Effects of HER2 Overexpression on HMEC Migration and Proliferation In response to EGF and HRG HER2 Overexpression Enhances Migration But Not Proliferation For Both EGF and HRG Treatment
Effects of HER2 Overexpression on HMEC Migration and Proliferation In response to EGF and HRG EGF Stimulates Migration and Proliferation More Vigorously than HRG
Effects of HER2 Overexpression on HMEC Migration and Proliferation In response to EGF and HRG -- thus, “context dependence” of HER2 overexpression effect Can We Understand How to Intervene in the ErbB Signaling Network to Abrogate the HER2-ox Effect?
PI3K/Akt Pathway is Strongly Implicated in HER2-mediated Cell Migration Yarden & Slikowski, Nat Rev Mol Cell Biol (2001)]
Can We Predict HER2-ox Cell Migration Effect in terms of PI3K/Akt Activity? *? Yarden & Slikowski, Nat Rev Mol Cell Biol (2001)]
Increased P-Akt Correlates with HER2-ox Enhancement of Migration HER2-ox cells + EGF 1 cell migration HER2-ox cells -- s.f. HER2-ox cells + HRG 0.5 parental cells -- s.f. 4 3 1 2 P-Akt (steady-state)
Inhibition of P-Akt Correlates with Diminished Migration for HRG Treatment HER2-ox cells + EGF 1 cell migration HER2-ox cells + HRG HER2-ox cells -- s.f. 0.5 HER2-ox cells + HRG + LY parental cells -- s.f. 4 3 1 2 P-Akt (steady-state)
BUT -- Inhibition of P-Akt Does NOT Correlate with Diminished Migration for EGF Treatment… HER2-ox cells + EGF 1 HER2-ox cells + EGF + LY cell migration HER2-ox cells + HRG HER2-ox cells -- s.f. 0.5 HER2-ox cells + HRG + LY parental cells -- s.f. 4 3 1 2 P-Akt (steady-state)
Hence, Must Turn to Multi-Variate Signaling Network Model for Effective Comprehension
Mass Spectrometry Phosphoproteomics H H R1 R1 O O CH3OH + CH3COCl Trizol Trypsin N N H 2N N OH OCH3 O O R2 R2 Peptide mixture Modified peptides Biological sample Extracted proteins IMAC Modified peptides Full Scan MS Modified phosphorylated peptides Reverse-phase LC MS/MS MS/MS MS/MS 1 n MASCOT or SEQUEST database search algorithm MS
(Relative) Quantitative Signaling Network Measurements via iTRAQ Labeling 5 min 10 min 30 min 1000 y2 0 min Intensity, counts m/z 500 y1 y3 200 400 600 800 1000 1200 b4 b3 b5 y4 114 115 116 117 y5 b9 b8 0 m/z EGFR pY1148 GSHQISLDNPDYQQDFFPK 2 x 10⁷ cells (HMEC) + EGF (0 min) + EGF (30 min) + EGF (10 min) + EGF (5 min) Lyse, denature, digest iTRAQ Label 116 114 115 117 Mix pS pS IMAC pS pT pS pY pY pY pY Anti-Phosphotyrosine peptide IP
EGFR pY1148 5 min 10 min 30 min 1000 y2 0 min Intensity, counts m/z 500 y1 y3 200 400 600 800 1000 1200 b4 b3 b5 y4 114 115 116 117 y5 b9 b8 0 m/z Signaling Network Activity: phospho-Y mass spec EGFR pY1148 GSHQISLDNPDYQQDFFPK 2 x 10⁷ cells (HMEC) + EGF (0 min) + EGF (30 min) + EGF (10 min) + EGF (5 min) Lyse, denature, digest iTRAQ Label 116 114 115 117 Mix pS pS IMAC pS pT pS pY pY pY pY Anti-Phosphotyrosine peptide IP
pTyr-MS results - A (332 sites across 175 proteins) Phosphorylated tyrosine ( )mapped on cell proliferation-associated proteins Yarden & Slikowski, Nat Rev Mol Cell Biol (2001)
pTyr-MS results - B (332 sites across 175 proteins) Phosphorylated tyrosine ( )mapped on cell migration-associated proteins Zamir & Geiger, J Cell Sci (2001)
62 pY Sites on 45 Proteins across 4 Time-Points for 6 Cell-Ligand Conditions
EGF HRG EGF EGF E G F R IP3 EPS15 Y849 GRB2 CBL E G F R E G F R Fold Change: Not registered x < 0.50 0.50 < x < 0.85 0.85 < x < 1.15 1.15 < x < 2.00 2.00 < x STAT3 Y455 Y705 Y239 H E R 2 H E R 3 H E R 2 Y317 SHC Y700 Y239/Y240 Y552 Ca++ Ca++ RAF MEK Y406 Ca++ Ca++ PKD AKT RAS SOS Her2 Overexpression Effects on EGF-Induced Signaling - A 0 5 10 30 Y877 Y974 Y1005 Y1045 Y1068 Y1127/Y1139 Y1328 Y1248 Y1148 Y1173 Y704 Y771 PLC- SRC Y418 Y1253 Y783 Y313 PKC S302/Y313 Y204 Y464 ERK1 T202 /Y204 P85 Y259 GAB1 P110 Y187 Y467 Y607 Y659 ERK2 T185 /Y187 Y580
Ligand Ca veo lin C A D H I N T E E R I N G R I N R T K Fold Change: Not registered x < 0.50 0.50 < x < 0.85 0.85 < x < 1.15 1.15 < x < 2.00 2.00 < x Y464 P85 P110 Y467 Y607 Y580 -Actinin SRC Y418 Vinculin GTP GEF F - A c t i n CRKL Her2 Overexpression Effects on EGF-Induced Signaling - B Y781 (1) Y6/Y14 Y187 Y1189 (4) Y14 ERK2 T185 /Y187 Y1207 (4) Y317 Y213 Y217 Y221 SHC Y239 Y96 Y228 Catenin- Y239/Y240 Y317 Y334 Y576 Y280 Y296 Y291 FAK Y22 S84/Y88 Y20 Catenin- Y118 Y88 PXN Y249 Y22 Y234 p130 Y19/Y22 Y387 Y327 Y1680 Y132 Y207 Y221 Y251
HRG EGF EGF EGF E G F R IP3 EPS15 Y849 GRB2 Y1328 CBL Y455 E G F R E G F R Fold Change: Not registered x < 0.50 0.50 < x < 0.85 0.85 < x < 1.15 1.15 < x < 2.00 2.00 < x H E R 2 H E R 2 H E R 3 Y700 Y552 Y239 Ca++ Y317 SHC Ca++ Y239/Y240 RAF MEK Ca++ Ca++ Y464 Y406 P85 Y259 GAB1 P110 Y467 Y607 Y659 PKD Y580 RAS AKT SOS HRG vs EGF Signaling - A Y974 Y877 Y1005 Y1068 Y1045 Y1127/Y1139 Y1248 Y1148 Y1173 Y704 STAT3 Y705 Y771 PLC- SRC Y418 Y1253 Y783 Y313 PKC S302/Y313 Y204 ERK1 T202 /Y204 Y187 ERK2 T185 /Y187
Ligand Ca veo lin C A D H I N T E E R I N G R I N R T K Fold Change: Not registered x < 0.50 0.50 < x < 0.85 0.85 < x < 1.15 1.15 < x < 2.00 2.00 < x -Actinin SRC Y418 Vinculin GTP GEF F - A c t i n CRKL HRG vs EGF Signaling - B Y781 (1) Y6/Y14 Y187 Y1189 (4) Y14 ERK2 T185 /Y187 Y1207 (4) Y317 Y213 Y217 Y221 SHC Y239 Y96 Y228 Catenin- Y239/Y240 Y317 Y334 Y464 Y576 Y280 Y296 P85 Y291 FAK Y467 P110 Y22 S84/Y88 Y607 Y20 Catenin- Y580 PXN Y118 Y88 Y249 Y22 Y234 p130 Y19/Y22 Y387 Y327 Y132 Y207 Y1680 Y221 Y251
Can we Quantitatively Comprehend (and Predict) Phenotypic Response from Signals across all Conditions (Cells, Stimuli, Drugs) Signals
Computational Analysis -- Spectrum of Methods SPECIFIED ABSTRACTED differential equations Markov chains Bayesian networks mechanisms Boolean/fuzzy logic models statistical mining (including molecular structure-based computation) influences relationships Appropriate approach depends on question and data
Principal Component / Partial Least-Square Regression-- elucidates key signal combinations governing responses #1 #2 PC3 Signal #1 PC1 #3 EGF #4 #5 HRG PC2 Proliferation or Migration
2-PC PLSR Model Accounts for both Parental HMEC and HER2-overexpressing HMEC Migration and Proliferation Behavior for All Ligand Treatments EGF EGF HRG X HRG X Thus, although signaling network activity is altered by HER2-ox, the “information-processing algorithm” relating signals to phenotypic behavior remains invariant
Translation to Targeted Phospho-Proteomic Assays -- a reduced model (9 phospho-sites on 6 proteins) recapitulates full model performance
… Including a priori Prediction of HER2-ox Effects on Proliferation and Migration under all Treatment Conditions Thus: the “information-processing algorithm” relating signals to phenotypic behavior of parental HMECs remains invariant for relating signals to phenotypic behavior of HER2-ox HMECs
Reduced Model Offers ‘Network Gauge’ for HER2-Mediated HMEC Proliferation and Migration Behavior -- “information-rich” integrative signals
Can Our Approach Comprehend and Predict Inhibitory Drug Effects? X gefitinib X LY294002 PD98059 X
Train PLSR Signal-Response Model on 5 pY Sites Across 6 Cell-Ligand Conditions for HMECs w/o Drugs
Predict Responses from Signals on 5 pY Sites Across 6 Cell-Ligand Conditions for HMECs with Drugs
a priori Prediction :Effects of 3 Kinase Inhibitors on HMEC Migration from 5 pY Signals
a priori Prediction :Effects of 3 Kinase Inhibitors on HMEC Migration from 5 pY Signals good PI3K/Akt inhibitor effect prediction (recall that uni-variate prediction was unsuccessful)
a priori Prediction :Effects of 3 Kinase Inhibitors on HMEC Migration from 5 pY Signals good MEK/Erk inhibitor effect prediction
a priori Prediction :Effects of 3 Kinase Inhibitors on HMEC Migration from 5 pY Signals under-prediction of EGFR inhibitor effect -- receptor level too far “upstream” for effective signal integration?
Encouragement: premise that cell behavior is governed by multi-variate network state may be useful for understanding drug effects
Computational Analysis -- Spectrum of Methods SPECIFIED ABSTRACTED differential equations Markov chains Bayesian networks mechanisms Boolean/fuzzy logic models statistical mining (including molecular structure-based computation) influences relationships Appropriate approach depends on question and data
Fuzzy Logic Models --Elucidating Upstream/Downstream Signal-Signal Influence Relationships
Kinase Substrate Phosphorylated sequence Motif* H2AX GKKATQASQEY [S/T]Q ATM BRCA1 QMRHQSESQGVGLSD LSQE CHK1 ENVKYSSSQPEPRTG [P/L/I/M]X[L/I/D/E] SQ EGFR PQQGFFSSPSTSRTP [S/T]P CDK1 SYN3 PQGQQPLSPQSGSPQ [S/T]PX[R/K] CDC23 QLRNQGETPTTEVPA PLCG1 IGTAEPDYGALYEGR [D/E]Y EGFR CBL TQEQYELYCEMGSTF [-/R/A]--[-/I]Y[F/V/I/E][I/F][FLIV]V GRB2 TGMFPRNYVTPVNRN EEEEYFELV EGFR STAENAEYLRVAPQS X[D/E]Y[I/L/V] Strategy: Take Advantage of Peptide Sequence Information -- kinase substrate motifs, phosphopeptide-binding domain substrate motifs * Motifs from http://hprd.org/
7-Time Point MRM EGFR Network Data[Wolf-Yadlin et al., PNAS USA (2007)] Foreground: 199 phospho-sites studied by MS downstream of EGF treatment Background: 334876 tyrosine-centered sites from the human proteome -1, -2, -3 D/E: EGFR kinase products +3P: Abl, Crk, Fyn SH2 domain ligands
Identifying more complicated motifs • Test the significance of enrichment of every amino acid (and selected combinations of amino acids) at each position • Test the significance of enrichment of each pair of amino acids at each pair of positions • For each significantly enriched sequence motif, test the significance of submotifs A greedy search allows us to look only at those nodes (of 3.2 x 10¹⁸) that are most likely to be statistically significant