Download
1 / 13
130 likes | 243 Views
Relationships between SPADs, Aerial Images, and Yield. Gaylia Ostermeier 1 , Larry Hendrickson 1 , John Sawyer 2 1 John Deere Ag Management Solutions 2 Iowa State University. Trial Design. 8 fields with 12 or 16-row treatment strips typically applied the length of field Treatments were

E N D
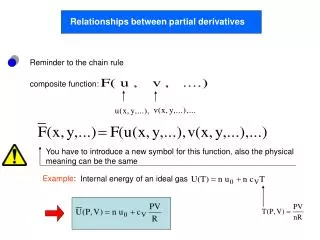
Relationships between SPADs, Aerial Images, and Yield Gaylia Ostermeier1, Larry Hendrickson1, John Sawyer2 1 John Deere Ag Management Solutions 2 Iowa State University
Trial Design • 8 fields with 12 or 16-row treatment strips typically applied the length of field • Treatments were • 0, 60, 120, and 240 lb N per acre for CS rotation • 0, 90, 180, and 270 lb N per acre for CC rotation • SPAD readings were taken at 89 to 126 locations in each field between V10 and V14 • Aerial image typically taken within 3 days of SPAD readings
Data Analysis • Extracted yield, GNDVI, and Relative Vigor (RV) using square regions of interest at each SPAD location
Related yield to SPAD, GNDVI, RV Definition of 100% for Relative Levels SPAD—Average of highest N rate for sensor and yields GNDVI—Average of highest N rate for sensor and yields RV— Average GNDVI value for “best” representative area and average yield for those pixels Data Analysis
Conclusions • Generally, images were equivalent or superior to SPAD readings on both an individual field basis or as a whole • RV can be obtained without reference strips and SPAD readings