Download
1 / 70
740 likes | 881 Views
Francisco Olivera 1998 ESRI User Conference GIS Hydro 98 - Preconference Seminar CRWR-PrePro July 26, 1998. CRWR-PrePro. Francisco “Paco” Olivera, Ph.D. Center for Research in Water Resources University of Texas at Austin. The Team. Brian Adams Ximing Cai Aubrey Dugger

E N D
Francisco Olivera 1998 ESRI User Conference GIS Hydro 98 - Preconference Seminar CRWR-PrePro July 26, 1998 CRWR-PrePro Francisco “Paco” Olivera, Ph.D. Center for Research in Water Resources University of Texas at Austin
The Team • Brian Adams • Ximing Cai • Aubrey Dugger • Ferdinand Hellweger • David Maidment • Francisco Olivera • Seann Reed
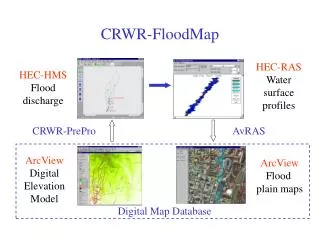
What is CRWR-PrePro? Spatial Data CRWR-PrePro Input file fornon-GIS applications
What is CRWR-PrePro today? Spatial Data CRWR-PrePro Basin file forHEC-HMS Not all HMS optionsare included yet.
CRWR-PrePro Components Watershed Characterization Hydrologic Model Extraction Model schematic andHEC-HMS basin file
What is HEC-HMS? • “It is a new generation software for precipitation-runoff simulation that supersedes the HEC-1 Flood Hydrograph Package.” HEC-HMS User’s Manual • It is a Windows version of HEC-1.
HEC-HMS Components Control File Time-related information for a simulation Basin FileParameter and connectivity data for hydrologic elements HEC-HMS Simulation Precipitation File Meteorological data
Previous Work Watershed DelineatorArcView Extension [ESRI-TNRCC] Flood Flow CalculatorArcView Extension[CRWR-TxDOT] HECPREPRO ArcView Project[CRWR-HEC] CRWR-PreProArcView Project [CRWR]
Watershed Characterization Terrain Analysis Stream-Watershed Delineation Calculation of Hydrologic Parameters
WatershedCharacterization Terrain Analysis
Terrain Analysis DEM[Grid] Burn-In Streams [Grid] Fill Sinks [Grid] DigitizedStream Network[Line Coverage] Flow Direction [Grid] Flow Accumulation [Grid]
Hydrologic GIS Functions 69 78 71 71 72 2 4 2 58 2 4 67 74 56 2 2 2 4 49 46 4 53 69 44 1 1 8 2 4 37 38 58 31 128 2 4 55 128 1 64 22 32 64 128 128 128 4 68 21 1 1 47 61 16 16 1 Digital elevation model (DEM) Flow direction grid 4 2 8 0 0 0 0 0 Flow direction codes 0 1 2 1 1 8 0 3 2 5 0 1 20 1 0 0 0 0 1 24 Flow accumulation grid Stream Network
Burn-In Streams 45 38 44 45 45 38 44 45 40 34 50 60 34 40 50 60 58 31 30 53 58 31 30 53 50 45 32 22 50 45 32 22 Digitized creek DEM creek 145 138 144 145 38 145 38 144 145 140 134 150 160 34 140 34 150 160 158 131 130 153 30 158 131 30 153 150 145 132 122 22 150 145 132 22 Raised DEM Digitized creek Burned-in DEM
Burned-In DEM • Elevation is increased by a fixed value in all DEM cells, except in those that coincide with the digitized stream network.
Flow Direction • Water flows to one of its neighbor cells according to the direction of the steepest descent. • Flow direction takes one out eight possible values.
Flow Accumulation • Flow accumulation is a measure of the drainage area in units of grid cells.
WatershedCharacterization Stream-Watershed Delineation
Stream-Watershed Delineation Stream NetworkDefinition Watershed OutletDefinition Raster to VectorConversion Watershed Delineation
AutomaticCells draining more area than a user-defined threshold value. InteractiveCells located downstream of user-identified cells. Stream Network[Grid] Stream Network Definition
Stream Network • All grid cells draining more than a user-defined threshold value (blue streams), or located downstream of user-defined cells (red streams) are part of the stream network.
Stream Segmentation • Stream segments (links) are the sections of a stream channel connecting two successive junctions, a junction and an outlet, or a junction and the drainage divide.
AutomaticMost downstream cells of the stream segments InteractiveUser-identified cells[outlets, reservoirs, control points, etc.] Watershed Outlets[Grid] Watershed Outlet Definition
Watershed Outlets • The most downstream cells of the stream segments (brown cells), and the user-defined points (red dots) are the watershed outlets.
Modified Stream Segmentation • The interactively defined outlets modify the stream segmentation by subdividing the segment in which are located into two segments.
Watershed Delineation Watershed Outlets Watershed Delineation
Watershed Delineation • The drainage area of each watershed outlet (stream segment) is delineated.
Raster to Vector Conversion WatershedVectorization StreamVectorization Dissolving SpuriousPolygons Merging of Watersheds
Raster to Vector Conversion • Streams and watersheds are converted from raster to vector format.
Dissolving Spurious Polygons • Cells connected to the main watershed polygon through a corner are defined as a separate polygon (spurious polygon). • These polygons are dissolved into the main polygon.
Merging of Watersheds • Adjacent watershed polygons can be merged into a single polygon, if they share their outlet or one flows into the other.
Merging of Watersheds • The attribute tables are updated so that the watershed code (WshCode) of the streams is modified and the area of the new polygon is calculated.
WatershedCharacterization Calculation of Hydrologic Parameters
Identification of the longest flow-path Length and slope of the longest flow-path Watershed Lag-Time (SCS) Flow length upstream and downstream AverageCurve Number Lag-time
Watershed Lag-Time (SCS) tp: watershed lag-time (min) LW: length of longest flow-path (ft) CN: average Curve Number S: slope of the longest flow-path (%)
Watershed Lag-Time (L/V) Flow length upstream and downstream Longest flow-path average velocity Length of the longest flow-path Lag-time
Watershed Lag-Time (L/V) tp: watershed lag-time (min) Lw: length of longest flow-path (ft) Vw: longest flow-path average velocity (m/s)
Watershed Abstractions Average Curve Number Initial Loss (mm)Constant Loss (mm/hr) SCS Method Initial + Constant Method
Stream Routing Method Flow time (Ls/Vs) Ls/Vs < Dt Ls/Vs > Dt Pure LagRouting MuskingumRouting
Pure Lag Routing tlag: stream lag-time (min) Ls: length of longest flow-path (m) Vs: longest flow-path average velocity (m/s)
Muskingum Routing K: Muskingum K (hr) X: Muskingum X Ls: length of longest flow-path (m) Vs: longest flow-path average velocity (m/s) n: number of sub-reaches
Hydrologic Model Extraction Watersheds Polygons Streams andsource streams Shape Files of Watersheds and Streams