Download
1 / 19
190 likes | 200 Views
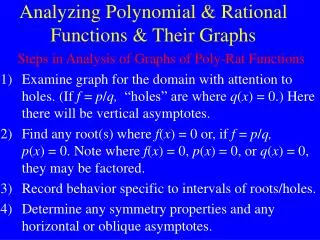
Rational Functions and Their Graphs. SUMMARY OF HOW TO FIND ASYMPTOTES. Vertical Asymptotes are the values that are NOT in the domain. To find them, set the denominator = 0 and solve. “WHAT VALUES CAN I NOT PUT IN THE DENOMINATOR????”.

E N D
SUMMARY OF HOW TO FIND ASYMPTOTES Vertical Asymptotes are the values that are NOT in the domain. To find them, set the denominator = 0 and solve. “WHAT VALUES CAN I NOT PUT IN THE DENOMINATOR????” • To determine horizontal or oblique asymptotes, compare the degrees of the numerator and denominator. • If the degree of the top < the bottom, horizontal asymptote along the x axis (y = 0) • If the degree of the top = bottom, horizontal asymptote at y = leading coefficient of top over leading coefficient of bottom • If the degree of the top > the bottom, oblique asymptote found by long division.
Finding Asymptotes There will be a vertical asymptote at any “illegal” x value, so anywhere that would make the denominator = 0 So there are vertical asymptotes at x = 4 and x = -1. VERTICAL ASYMPTOTES Let’s set the bottom = 0 and factor and solve to find where the vertical asymptote(s) should be.
HORIZONTAL ASYMPTOTES We compare the degrees of the polynomial in the numerator and the polynomial in the denominator to tell us about horizontal asymptotes. 1 < 2 degree of top = 1 If the degree of the numerator is less than the degree of the denominator, (remember degree is the highest power on any x term) the x axis is a horizontal asymptote. If the degree of the numerator is less than the degree of the denominator, the x axis is a horizontal asymptote. This is along the line y = 0. 1 degree of bottom = 2
HORIZONTAL ASYMPTOTES The leading coefficient is the number in front of the highest powered x term. If the degree of the numerator is equal to the degree of the denominator, then there is a horizontal asymptote at: y = leading coefficient of top leading coefficient of bottom degree of top = 2 1 degree of bottom = 2 horizontal asymptote at:
SLANT ASYMPTOTES If the degree of the numerator is greater than the degree of the denominator, then there is not a horizontal asymptote, but an oblique one. The equation is found by doing long division and the quotient is the equation of the oblique asymptote ignoring the remainder. degree of top = 3 degree of bottom = 2 Oblique asymptote at y = x + 5
vertical translation, moved up 3 Graph This is just the reciprocal function transformed. We can trade the terms places to make it easier to see this. The vertical asymptote remains the same because in either function, x ≠ 0 The horizontal asymptote will move up 3 like the graph does.
Strategy for Graphing a Rational Function • Graph your asymptotes • Plot points to the left and right of each asymptote to see the curve
The vertical asymptote is x = -2 • The horizontal asymptote is y = 2/5
Sketch the graph of: Vertical asymptotes at?? x = 1 Horizontal asymptote at?? y = 0
Sketch the graph of: Vertical asymptotes at?? x = 0 Horizontal asymptote at?? y = 0
Sketch the graph of: Vertical asymptotes at?? x = 0 Horizontal asymptote at?? y = 0
Sketch the graph of: Vertical asymptotes at?? x = 1 Horizontal asymptote at?? y = 0 Hopefully you remember, y = 1/x graph and it’s asymptotes: Vertical asymptote: x = 0 Horizontal asymptote: y = 0
Or… We have the function: But what if we simplified this and combined like terms: Now looking at this: Vertical Asymptotes?? x = -3 Horizontal asymptotes?? y = -2
Sketch the graph of: Hole at?? x = 0
Find the asymptotes of each function: Vertical Asymptote: x = 0 Slant Asymptote: y = x + 3 Hole at x = 4 Vertical Asymptote: x = 0 and x = 7 Horizontal Asymptote: y = 0