Download

1 / 30
540 likes | 906 Views
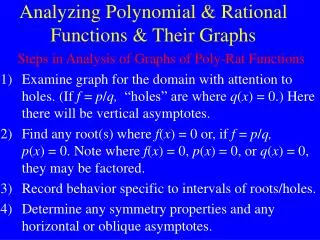
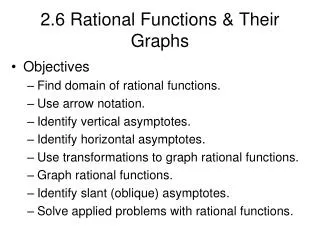
Rational Functions and Their Graphs. Objectives Find the domain of rational functions. Find horizontal and vertical asymptotes of graphs of rational functions. Analyze and sketch graphs of rational functions. Rational Functions.

E N D
Rational Functions and Their Graphs Objectives Find the domain of rational functions. Find horizontal and vertical asymptotes of graphs of rational functions. Analyze and sketch graphs of rational functions.
Rational Functions • A rational function is the ratio of two polynomial functions • Asymptote comes from combining 3 Greek words “an-sum-piptein” meaning “does not fall together with”. An asymptote is a curve that another curve approaches but does not ultimately cross.
Finding the domain of a rational function Rational functions contain division. Because division by zero is undefined, we must solve for the polynomial in the denominator for if it equals zero. Solve: x− 3 = 0 x = 3 (the restriction) Domain of f = {x│x ≠ 3) set-builder notation Domain of f = (− ∞, 3) ⋃ (3, ∞) interval notation The Domain of is all real numbers except 3.
Find the domain of the rational function Solve for Answer in set-builder notation is Answer in interval notation is The domain of is all real numbers except
Find the domain of the rational function Since we don’t have a restriction, the domain will be all real numbers. Answer in set-builder notation is Answer in interval notation is
The Reciprocal Function The domain of this function is all real numbers except zero. Let’s look at the behavior of this function on the left of zero.
The Reciprocal Function xis approaching zero from the left. As x approaches 0 from the left, what are the y-values, f(x), doing? They are decreasing without bound towards negative infinity.
The Reciprocal Function We use a special arrow notation to describe this situation. As f(x) → − ∞ This is read, “As x approaches 0 from the left, f(x) approaches negative infinity.”
The Reciprocal Function xis approaching zero from the right. As x approaches 0 from the right, what are the y-values, f(x), doing? They are increasing without bound towards positive infinity.
The Reciprocal Function We use a special arrow notation to describe this situation. As , f(x) → ∞ This is read, “As x approaches 0 from the right, f(x) approaches infinity.”
Arrow Notation SymbolMeaning x approaches from the right x approaches from the left x approaches infinity x approaches negative infinity
Vertical Asymptotes Refer to page 343 in your book. The line x = a is a vertical asymptote of the graph of a function f if f(x) increases or decreases without bound as x approaches a. A graph may have more than one vertical asymptote. It may have no vertical asymptotes. Look at the four examples on page 343. The dotted lines represent the asymptotes. Think of them as an electric fence which can be approached closely but cannot be touched.
Locating Vertical Asymptotes Step 1: Simplify the rational function, if possible. Step 2: Solve for the polynomial in the denominator for if it equals zero. Find the vertical asymptotes, if any, of the graph of: Check out the graph on the graphing calculator.
Locating Vertical Asymptotes Find the vertical asymptotes, if any, of the graph of: Check out graph on the graphing calculator. • Step 1: Simplify the rational function, if possible. • Step 2: Solve for the polynomial in the denominator for if it equals zero.
Locating Vertical Asymptotes Find the vertical asymptotes, if any, of the graph of: Check out graph on the graphing calculator. • Step 1: Simplify the rational function, if possible. • Step 2: Solve for the polynomial in the denominator for if it equals zero.
Graphing a Rational Function with a Hole Example: Graph Solution: Notice the domain of the function cannot include 2. Rewrite f in lowest terms by factoring the numerator. The graph of f is the graph of the line y = x + 2 with the exception of the point with x-value 2.
Horizontal Asymptotes The line y = b is a horizontal asymptote of the graph of a function f if f(x) approaches b as x increases or decreases without bound. As As As The dotted lines represent the asymptote. There can at most only be one horizontal asymptote. The graph may cross its horizontal asymptote.
Locating Horizontal Asymptotes • The degree of the numerator is n. The degree of the denominator is d. • If n < d, the x-axis, or y = 0, is the horizontal asymptote of the graph. • If n = d, the horizontal asymptote will be: • If n > d, the graph has no horizontal asymptotes.
Find the horizontal asymptote: Compare the lead degrees of the two polynomials. The degree of the numerator is less than the degree of the denominator. • If n < d, the x-axis, or y = 0, is the horizontal asymptote of the graph.
Find the horizontal asymptote: • Compare the lead degrees of the two polynomials. • The degree of the numerator is the same as the degree of the denominator. • If n = d, the horizontal asymptote will be: ; The horizontal asymptote is .
Find the horizontal asymptote: h • Compare the lead degrees of the two polynomials. • The degree of the numerator is greater than the degree of the denominator. • If n > d, the graph has no horizontal asymptotes.
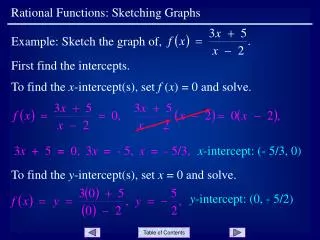
Graphing Rational Functions Simplify, if possible, the rational function. Find the y-intercept (if there is one) by substituting 0 for every x-variable. Find the x-intercepts (if there are any) by letting f(x) be zero. Find any vertical asymptotes. Find the horizontal asymptotes (if there is one). Plot several points between and beyond each x-intercept and vertical asymptote. Complete the sketch.
Graphing A Rational Function • Step 1: Simplify, if possible, the rational function. Is it simplified? Yes • Step 2: Find the y-intercept (if there is one) by substituting 0 for every x-variable. What is the y-intercept? • Step 3: Find the x-intercepts (if there are any) by letting f(x) be zero. The x-intercept is
Graphing A Rational Function • Step 4: Find any vertical asymptotes. • Solve for the polynomial in the denominator for if it equals zero. • Step 5: Find the horizontal asymptotes (if there is one). • Compare the lead degrees of the two polynomials. • If n = d, the horizontal asymptote will be
Graphing A Rational Function • Step 6: Plot several points between and beyond each x-intercept and vertical asymptote. • Final Step: Complete the sketch.