Download
1 / 33
330 likes | 431 Views
Graphs of Rational Functions. MA3A1. Students will explore rational functions.

E N D
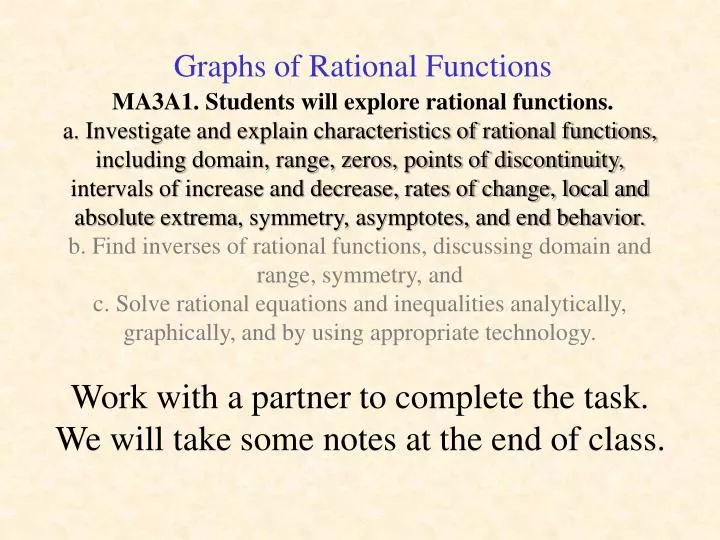
Graphs of Rational Functions MA3A1. Students will explore rational functions. a. Investigate and explain characteristics of rational functions, including domain, range, zeros, points of discontinuity, intervals of increase and decrease, rates of change, local and absolute extrema, symmetry, asymptotes, and end behavior. b. Find inverses of rational functions, discussing domain and range, symmetry, and c. Solve rational equations and inequalities analytically, graphically, and by using appropriate technology. Work with a partner to complete the task. We will take some notes at the end of class.
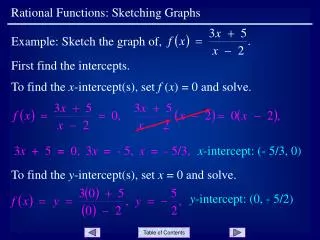
Graphing Rational Functions When you studied quadratic functions, you learned that the graph of y = (x − h)2 + k has its vertex at (h, k). Example: y = (x − 1)2 + 2 Vertex: (1, 2) The graph shifts 1 unit to the right and 2 units up. Keep this information in mind as we study a new type of function!!!!!
A rational function is a function that can be expressed in the form where both f(x) and g(x) are polynomial functions. Examples of rational functions would be:
Very Important definitions: Vertical asymptoteoccurs at values of x for which the function is undefined (exception: a hole . . . we’ll talk about that later). Horizontal asymptoteoccurs if the function approaches a specific value when x approaches infinity or negative infinity. What happens to y when x gets REALLY big or REALLY small? To graph rational functions, ALWAYS figure out the asymptotes FIRST. Then you can plot specific points!!!!
Consider: Domainf= (, 0), (0, ) Vertical asymptote will occur at x = 0. Horizontal asymptote will occur at y = 0. Think what happens when you divide 1 by a VERY large number!!!!! Show your asymptotes!! Pick some x’s on each side of the vertical asymptote to see the graph!!!
x y x Y −3 3 −2 2 −1 1 −.5 .5 -.3333 .3333 -.5 .5 -1 1 -2 2 In most cases, the range will be closely related to the horizontal asymptote . . . be sure to check the graph. Rangef= (, 0), (0, ) Note: the graph represents a hyperbola centered at (0, 0)
Consider: This function has one value of x that is banned from the domain. What value of x do you think that would be? And why? If you guessed x = 2, congratulations. This is the value at which the function is undefined because x = 2 generates 0 in the denominator. Consider the graph of the function. What impact do you think this forbidden point will have on the graph?
x 1.5 1.7 1.9 2.0 Now just because we cannot use x = 2 in our x-y table, it does not mean that we cannot use values of x that are close to 2. Fill in the values in the table below. As we pick values of x that are smaller than 2 but closer and closer to 2 what is happening to y? -2 -3.33 -10 undefined If you said that y is getting closer and closer to negative infinity, nice job!
x 1.5 1.7 1.9 2.0 2.1 2.3 2.5 Now fill in the values in the rest of the table. What about the behavior of the function on the other side of x = 2? As we pick values of x that are larger than 2 but closer and closer to 2 what do you think is happening to y? -2 -3.33 -10 Und If you said that y is getting closer and closer to positive infinity, you are right on the money! 10 3.33 2
This dotted vertical line is a crucial visual aid for the graph. Do you know what the equation of this dotted line is? Let’s see what the points that we have calculated so far would look like on graph. The equation is x = 2 because every point on the line has an x coordinate of 2.
Do you know what this dotted vertical line is called? Hint: it is one of the many great and imaginative words in mathematics. The line x = 2 is a vertical asymptote.
Our graph will get closer and closer to this vertical asymptote but never touch it. If f(x) approaches positive or negative infinity as x approaches c from the right or the left, then the line x = c is a vertical asymptote of the graph of f.
A horizontal asymptote is a horizontal line that the graph gets closer and closer to but never touches. The official definition of a horizontal asymptote: The line y = c is a horizontal asymptote for the graph of a function f if f(x) approaches c as x approaches positive or negative infinity. Huh?! Don’t you just love official definitions? At any rate, rational functions have a tendency to generate asymptotes, so lets go back to the graph and see if we can find a horizontal asymptote.
Looking at the graph, as the x values get larger and larger in the negative direction, the y values of the graph appear to get closer and closer to what? If you guessed that the y values appear to get closer and closer to 0, you may be onto something. Let’s look at a table of values for confirmation.
Calculate the y values in the table below. What is your conclusion about the trend? x 0 -5 -20 -100 -(1/2) -(1/7) -(1/22) -(1/102) Conclusion: as the x values get closer and closer to negative infinity, the y values will get closer and closer to 0. Question: will the same thing happen as x values get closer to positive infinity?
As How about a guess? What do you think is going to happen to the y values of our function as the x values get closer to positive infinity? As By looking at the fraction analytically, you can hopefully see that very large values of x will generate values of y very close to 0. If you are uneasy about this, expand the table in the previous slide to include values like x = 10, 100, or 1000.
Note how the graph is very much dominated by its asymptotes. You can think of them as magnets for the graph. This problem was an exploration but in the future, it will be very important to know where your asymptotes are before you start plotting points. Vertical Asymptote at x = 2 Horizontal Asymptote at y = 0.
You try… Can we pick out the asymptotes analytically before we start plotting points in an x-y table? Do we have a vertical asymptote? If so, at what value of x? We have a vertical asymptote at x = 3 because at that value of x, the denominator is 0 but the numerator is not. Congratulations if you picked this out on your own. The horizontal asymptote is a little more challenging, but go ahead and take a guess.
Notice though that as values of x get larger and larger, the 3 in the denominator carries less and less weight in the calculation. As the 3 “disappears”, the function looks more and more like… which reduces to y = -2. This means that we should have a horizontal asymptote at y = -2. We already have evidence of a vertical asymptote at x = 3. So we are going to set up the x-y table then with a few values to the left of x = 3 and a few values to the right of x = 3. To confirm the horizontal asymptote we will also use a few large values of x just to see if the corresponding values of y will be close to y = -2.
Take a few minutes and work out the y values for this table. x -5 0 2.5 3 3.5 5 10 50 -10/8 = -1.25 0 5/.5 = 10 Undefined 7/-.5 = -14 10/-2 = -5 20/-7 = -2.86 100/-47= -2.13 Don’t be lazy now, work them out yourself. As expected, y values tend to explode when they get close to the vertical asymptote at x = 3. Also, as x values get large, y values get closer and closer to the horizontal asymptote at y = -2. The graph is a click away.
Here is the graph with most of the points in our table. Vertical asymptote at x = 3. Horizontal asymptote at y = -2.
Believe it or not, you are now sophisticated enough mathematically to draw conclusions about the graph three ways: Analytically: finding asymptotes with algebra!! Numerically: supporting and generating conclusions with the x-y table!! Graphically: a visual look at the behavior of the function. If your conclusions from the above areas do not agree, investigate further to uncover the nature of the problem.
This is a rational function so we have potential for asymptotes and this is what we should investigate first. Take a minute to form your own opinion before you continue. Hopefully you began by setting the denominator equal to 0. It appears that we may have vertical asymptotes at x = 0 and at x = 2. We will see if the table confirms this suspicion.
x -2 -1 -.5 -.1 0 1 1.5 1.9 2 0 -1 -3 -19 Und 3 2.33 2.05 Und See anything peculiar? Notice that as x values get closer and closer to 0, the y values get larger and larger. This is appropriate behavior near an asymptote. But as x values get closer and closer to 2, the y values do not get large. In fact, the y values seem to get closer and closer to 2. Now, if x =2 creates 0 in the denominator why don’t we have an asymptote at x = 2?
Does this mean that and are identical functions? We don’t get a vertical asymptote at x = 2 because when x = 2 both the numerator and the denominator are equal to 0. In fact, if we had thought to reduce the function in the beginning, we could have saved ourselves a lot of trouble. Check this out: Yes, at every value of x except x = 2 where the former is undefined. There will be a tiny hole in the graph where x = 2.
x 10 100 1000 1.2 1.02 1.002 As we look for horizontal asymptotes, we look at y values as x approaches plus or minus infinity. The denominator will get very large but so will the numerator. As was the case with the previous function, we concentrate on the ratio of the term with the largest power of x in the numerator to the term with the largest power of x in the denominator. As x gets large… You can verify this in the table. So, we have a horizontal asymptote at y = 1.
To summarize then, we have a vertical asymptote at x = 0, a hole in the graph at x = 2 and a horizontal asymptote at y = 1. Here is the graph with a few of the points that we have in our tables. Hole in the graph. Horizontal asymptote at y = 1. Vertical asymptote at x = 0.
x y x Y −3 –1 −4 0 Last example: Vertical asymptote will correspond to the value that makes the denominator 0. Horizontal asymptote: y = Asymptotes: x = –2 y = 3 8 –2 5.5 .5 Df = (, 2), (2, ) Rf = (, 3), (3, )
x = 4; y = 1 Remember: Find the asymptotes FIRST. Show them on the graph!!! Pick x values to the right and to the left of the vertical asymptote(s). Use the points along with the asymptotes to sketch the graph!!!
Defining rational functions and describing their domain. A function that is defined by a rational expression is called a Rational Function and has the form: Note: The domain of a rational function contains all real numbers except those that make Q(x) = 0. • Example 2: Find all numbers that are in the domain of each rational function
Defining rational functions and describing their domain. A function that is defined by a rational expression is called a Rational Function • Example 3: Find all numbers that are in the domain of each rational function
Defining rational functions and describing their domain. Example 4: Find all numbers that are in the domain of each rational function