Download
1 / 43
640 likes | 2.02k Views
Autocorrelation. Danny Vandeput & Lasse Hansen Asset Optimization Division Machinery Health Management . Autocorrelation, R, is a mathematical tool for finding repetitive patterns , such as find the presence of a periodic signal which has been buried under noise, or

E N D
Autocorrelation Danny Vandeput & Lasse Hansen Asset Optimization Division Machinery Health Management
Autocorrelation, R, is a mathematical tool for finding repetitive patterns, such as find the presence of a periodic signal which has been buried under noise, or identify the missing fundamental frequency in a signal implied by its harmonic frequencies. Definition
It is used frequently in signal processing for analyzing functions or series of values, such as time domain signals. Informally, it is the similarity between observations as a function of the time separation between them. More precisely, it is the cross-correlation of a signal with itself. Definition
Use of Autocorrelation, examples Doppler Radar Techniques for Estimation of target velocity Imaging of Blood Flow used in Medical Ultrasonography. .. . Vibration Analysis
Common tools in Vibration Analysis on Rotating Machinery are: Digitally capture of a Band Limited Time Waveform at a predetermined sampling (digitization) rate for a specified data block size Spectral Analysis (usually via FFT) of the Time Waveform. For standard vibration analysis, it is customary to carry the spectral analysis out in the velocity domain (mm/sec, RMS)
Common tools in Vibration Analysis on Rotating Machinery are: In addition to the velocity spectral analysis, a special analysis recommended by EPM is the capture of a time block consisting of acceleration “peak values” (PeakVueTMtime waveform) compute the PeakVue spectral data in a manner analogous to the velocity (or acceleration) spectral data Another tool available with EPM is the Autocorrelation Waveform. The autocorrelated waveform is a method for determining the periodic or random energy in the waveform
Why use Autocorrelation in Vibration Analysis The strength in the autocorrelation function is its ability to identify low repetition rate events with low duty cycle ability to separate random events from periodic events The autocorrelation function also supplies a means to approximate the percentage of energy in the time waveform that is either from the periodic energy or from the random energy.
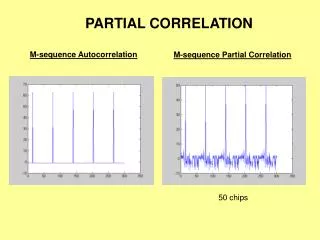
Why use Autocorrelation in Vibration Analysis The Autocorrelation Coefficient function is not an average value obtained over the entire block of data at a specific narrow band such as the spectral data. The resultant fact is, that low duty cycle (low frequency) periodic data shows up very strongly in the Autocorrelation Coefficient data. The higher frequency periodic data (high duty cycle) is more obvious in the spectral data than in the autocorrelation data.
The Autocorrelation Coefficient function has proven valuable as a tool to aid in the interpretation of vibration data (especially for the PeakVue analysis). The key properties are: For random data, the value will approach zero For periodic data with no (or little) noise, the value will approach 1 at the period (1/frequency) of the periodic data How to use Autocorrelation in Vibration Analysis
The pattern of the periodic peaks can be very helpful in identifying the fault type. Any defect that is amplitude modulated will clearly have the modulation frequency shown. When autocorrelation is performed, the waveform will be reduced to ½ its original length in time due to the autocorrelation function process. This should be remembered when using it as a diagnostics tool to identify very slow speed faults How to use Autocorrelation in Vibration Analysis
Useful Properties The autocorrelation coefficient function is a mathematical process used to determine how much of the waveform energy is periodic. The amplitude scale is always -1 to +1. The scale is not related to normal vibration units (acceleration, velocity, displacement). If the amplitude value is near zero, almost all of the waveform energy is from a fault generating mostly random impacting, (e.g. lubrication fault).
Generated signal with almost all noise • Autocorrolation waveform shows no periodic energy • Almost all energy is from random events
Useful Properties (partially repeated) If the amplitude value is near zero, almost all of the waveform energy is from a fault generating mostly random impacting ( e.g. lubrication fault). If the amplitude is near 1, almost all of the energy is from a periodic fault. The period between the peaks will determine the frequency of the fault
Autocorrolated waveform indicating a max amplitude of value of 0,984 at the rate of the periodic energy
Autocorrolation amplitude is 0,93 indicating that almost all the energy is from a periodic source
The period of the autocorrolated waveform is 86,5 Hz being generated by bearing outer race Autocorrelation function allows adding fault frequencies to indicate the cause of the periodicity
Useful Properties (partially repeated) If the amplitude value is near zero, almost all of the waveform energy is from a fault generating mostly random impacting ( e.g. lubrication fault). If the amplitude is near 1, almost all of the energy is from a periodic fault. The period between the peaks will determine the frequency of the fault The amplitude value of the periodic event will be somewhere between 0 and 1 The square root of the peak amplitude will be the approximate percentage (fraction) of energy contributed by the fault with that period
Square root of 0,92 is 0,96, so 96% of the energy (aprox 21,5 g of the 22,35 g) is generated by the outer race fault
Summary Time Synchronous Averaging (vector averaging) highlights events synchronous to the trigger event. Energy not synchronous to the trigger will be removed. Autocorrelation averaging (scalar averaging) highlights periodic events (including synchronous and non-synchronous events) Periodic events are highlighted by both normal FFT spectra and autocorrelation
Summary Spectra has an advantage for defects generating higher frequencies Autocorrelation has an advantage for lower frequency defects Autocorrelation provides a means to determine the approximate percentage of the waveform energy which is due to the periodic event
Summary Autocorrelation is a very useful feature to detect cage problems and BSF problems. Both are typically very low in amplitude and are hidden into the random time waveform. Also defects like gear mesh problems can be diagnosed using autocorrelation
Cases Looseness Cage problem Bearing Defect with Lube Fault Ultra Low Speed bearing problem
Case # 1 Looseness 1x and harmonics, not necessarily looseness Data indicates some high frequency energy excited by a low frequency event impacts up to 63.78 g’s and a very random pattern
Case # 1 Looseness Autocorrelated waveform indicates a change in speed during the acquisition time Period of 1x seems regular for the first half of waveform But then it changes Second half of the Autocorrelated waveform also indicates a 1x, it is only slightly changed
Case # 1 Looseness This zoom indicates little periodic content Bearing Inner Race was very loose on the shaft, turning slightly at the shaft, so the 1x period was shifted
Case # 2 Cage fault – bearing installationSpectrum and Waveform indicating cage defect Fan with a speed of 890 RPM
Case # 2 Cage fault – bearing installationNot sharp peaks like a cracked or broken cage No indication of high frequency riding on low frequency content
Photo of bearing in Pillow Block Housing The axial trust with the misaligned races generated high frequency energy as the cage rotated through the tight spot
Case # 3 Ultra Low Speed Bearing ProblemOuter race defect indicated in spectral data on gearbox, 0,4 RPM
Case # 3 Ultra Low Speed Bearing Problem Highest value is 0,118 indicating aprox 34% energy From outer race fault or 0,41g’s. PeakVue Assistant does not calculate below 4 rpm indicates here alert value to 0,2g and fault level 0,4g
Case # 4 Bearing with Defect and Lube Fault PeakVue spectrum and waveform show a clear BPFO defect
Case # 4 Bearing with Defect and Lube Fault Only about 13.9% (√0.01933) of the energy is coming from the BPFO Rest of the energy is random and related to a lube fault
Autocorrelation Circular Plot Combined with the Circular Plot the Autocorrelation can also provide very good information about the load zone
Autocorrelation Circular Plot Autocorrolation waveform in circular format indicating non-synchronous impacting with amplitude modulation at turning speed. Typical for Inner Race defect The same can be applied to gearboxes
How to use Autocorrelation? The use of Autocorrelation does not require any special setup or knowledge. Simply go to the time waveform (either the standard TWF or the PeakVue TWF) Right mouse click – choose Autocorrelate and perform the function
About 53% of the energy in thewaveform is coming from a BPFO defect