Download

1 / 19
210 likes | 372 Views
12 Autocorrelation. Serial Correlation exists when errors are correlated across periods -One source of serial correlation is misspecification of the model (although correctly specified models can also have autocorrelation) -Serial correlation does not make OLS biased or inconsistent

E N D
12 Autocorrelation Serial Correlation exists when errors are correlated across periods -One source of serial correlation is misspecification of the model (although correctly specified models can also have autocorrelation) -Serial correlation does not make OLS biased or inconsistent -Serial correlation does ruin OLS standard errors and all significance tests -Serial correlation must therefore be corrected for any regression to give valid information
12. Serial Correlation and Heteroskedasticity in Time Series Regressions 12.1 Properties of OLS with Serial Correlation 12.2 Testing for Serial Correlation 12.3 Correcting for Serial Correlation with Strictly Exogenous Regressors 12.5 Serial Correlation-Robust Inference after OLS 12.6 Het in Time Series Regressions
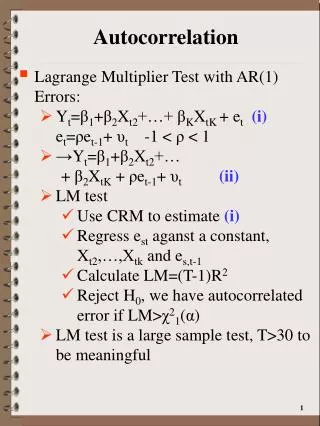
12.1 Serial Correlation and se Assume that our error terms follow AR(1) SERIAL CORRELATION : -where et are uncorrelated random variables with mean zero and constant variance -assume that |ρ|<1 (stability condition) -if we assume the average of x is zero, in the model with one independent variable, OLS estimates:
12.1 Serial Correlation and se Computing the variance of OLS requires us to take into account serial correlation in ut: -Evidently this is much different than typical OLS variance unless ρ=0 (no serial correlation)
12.1 Serial Correlation Notes -Typically, the usual OLS formula for variance underestimates the true variance in the presence of serial correlation -this variance bias leads to invalid t and F statistics -note that if the data is stationary and weakly dependent, R2 and adjusted R2 are still valid measures of goodness of fit -the argument is the same as for cross sectional data with heteroskedasticity
12.2 Testing for Serial Correlation -We first test for serial correlation when the regressors are strictly exogenous (ut is uncorrelated with all regressors over time) -the simplest and most popular serial correlation to test for is the AR(1) model -in order to the strict exogeneity assumption, we need to assume that:
12.2 Testing for Serial Correlation -We adopt a null hypothesis for no serial correlation and set up an AR(1) model: -We could estimate (12.13) and test if ρhat is zero, but unfortunately we don’t have the true errors -luckily, due to the strict exogeneity assumption, the true errors can be replaced with OLS residuals
Testing for AR(1) Serial Correlation with Strictly Exogenous Regressors: • Regress y on all x’s to obtain residuals uhat • Regress uhatt on uhatt-1 and obtain OLS estimates of ρhat • Conduct a t-test (typically at the 5% level) for the hypotheses: Ho: ρ=0 (no serial correlation) Ha: ρ≠0 (AR(1) serial correlation) Remember to report p-value
12.2 Testing for Serial Correlation -If one has a large sample size, serial correlation could be found with a small ρhat. -in this case typical OLS inference will not be far off -note that this test can detect ANY serial correlation that causes adjacent error terms to be correlated -correlation between ut and ut-4 would not be picked up however -if the AR(1) formula suffers from HET, Heteroskedastic-robust t statistics are used
12.2 Durbin-Watson Test Another classic test for AR(1) serial correlation is the Durbin-Watson test. The Durbin-Watston (DW) statistic is calculated from OLS residuals: -It can be shown that the DW statistic is linked to the previous test for AR(1) serial correlation:
12.2 DW Test Even with moderate sample sizes, (12.16) is relatively close -the DW test does, however, depend on ALL CLM assumptions -typically the DW test is computed for the alternative hypothesis Ha:ρ>0 (since rho is usually positive and rarely negative) -from (12.16) the null hypothesis is rejected if DW is significantly less than 2 -unfortunately the null distribution is difficult to determine for DW
12.2 DW Test -The DW test produces two sets of critical values, dU (for upper), and dL (for lower) -if DW<dL, reject H0 -if DW>dU, do not reject Ho -otherwise the tests is inconclusive -the DW test has an inconclusive region and requires all CLM assumptions -the t test can be used asymptotically and can be corrected for heteroskedasticity -Therefore t tests are generally preferred to DW tests
12.2 Testing without Strictly Exogenous Regressors -it is often the case that explanatory variables are NOT strictly exogenous -one or more xtj are correlated with ut-1 -ie: when yt-1 is an explanatory variable -in these cases typical t or DW tests are invalid -Durbin’s h statistic is one alternative, but cannot always be calculated -the following test works for both strictly exogenous and not strictly exogenous regressors
Testing for AR(1) Serial Correlation without Strictly Exogenous Regressors: • Regress y on all x’s to obtain residuals uhat • Regress uhatt on uhatt-1 and all xt variables obtain OLS estimates of ρhat (coefficient of uhatt-1) • Conduct a t-test (typically at the 5% level) for the hypotheses: Ho: ρ=0 (no serial correlation) Ha: ρ≠0 (AR(1) serial correlation) Remember to report p-value
12.2 Testing without Strictly Exogenous Regressors -the different in this testing sequence is uhatt is regressed on: 1) uhatt-1 2) all independent variables -a heteroskedasticity-robust t statistic can also be used if the above regression suffers from heteroskedasticity
12.2 Higher Order Serial Correlation Assume that our error terms follow AR(2) SERIAL CORRELATION : -here we test for second order serial correlation, or: As before, we run a typical OLS regression for residuals, and then regress uhatt on all explanatory (x) variables, uhatt-1 and uhatt-2 -an F test is then done on the joint significance of the coefficients of uhatt-1 and uhatt-2 -we can test for higher order serial correlation:
Testing for AR(q) Serial Correlation • Regress y on all x’s to obtain residuals uhat • Regress uhatt on uhatt-1, uhatt-2,…, uhatt-q and all xt variables obtain OLS estimates of ρhat (coefficient of uhatt-1) • Conduct an F-test (typically at the 5% level) for the hypotheses: Ho: ρ1= ρ2=…= ρq=0 (no serial correlation) Ha: Not H0 (AR(1) serial correlation) Remember to report p-values
12.2 Testing for Higher Order Serial Correlation -if xtj is strictly exogenous, it can be removed from the second regression -this test requires the homoskedasticity assumption: -but if heteroskedasticity exists in the second equation a heteroskedastic-robust transformation can be made as described in Chapter 8
12.2 Seasonal forms of Serial Correlation Seasonal data (ie: quarterly or monthly), might exhibit seasonal forms of serial correlation: -our test is similar to that for AR(1) serial correlation, only the second regression includes ut-4 or the seasonal lagged variable instead of ut-1