Download

1 / 32
330 likes | 450 Views
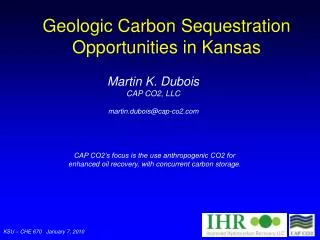
Geologic Carbon Sequestration Opportunities in Kansas. Martin K. Dubois CAP CO2, LLC martin.dubois@cap-co2.com. CAP CO2’s focus is the use anthropogenic CO2 for enhanced oil recovery, with concurrent carbon storage. Outline – Growing Opportunities. Geologic sequestration A key alternative

E N D
Geologic Carbon Sequestration Opportunities in Kansas Martin K. Dubois CAP CO2, LLC martin.dubois@cap-co2.com CAP CO2’s focus is the use anthropogenic CO2 for enhanced oil recovery, with concurrent carbon storage.
Outline – Growing Opportunities • Geologic sequestration • A key alternative • Costs • Kansas geology suitability and capacity • Kansas projects • Interim solution: Concurrent Enhanced Oil Recovery (EOR) and Carbon Capture and Storage (CCS) • “Green” oil with industrial CO2 • Technical requirements • Kansas opportunities and economic impact
CO2 Basics • 1 ton CO2 = 17.2 mcf • 1 metric ton = 19 mcf • An average human exhales 6 mcf CO2/ yr • Combustion of 1 barrel of oil yields 8 mcf CO2 • 7 mcf CO2 / BO (Net utilization: Sequestered) • Ethanol (55mgy) – 8.3 mmcfd, 0.16 million tonnes/yr (1-2 mbopd) • Coffeyville fertilizer plant – 40 mmcfd, 0.8 million tonnes/yr (6-8 mbopd) • New Sunflower 895 MW plant deal – 6.7 million tons/yr • Kansas: • Total 72.8 Million Metric Tons/Year • Coal-fired Power 37.2 Million Metric Tons/Year Handy CO2 properties calculator: http://abyss.kgs.ku.edu/pls/abyss/natcarb.co2_calc.co2_prop
Source: NATCARB, NETL Power Ethanol Cement US Stationary CO2 Sources Kansas 73 Million Tons/Year Power 37 Million Tons/Year Carbon legislation + Carbon capture + Need for geologic storage + CO2 pipeline infrastructure = Opportunity for CCS and CO2 EOR in Kansas
Kansas CO2 Sources and Oil Resource Oil Oil & Gas Gas CBM Russell Project Sugar Creek Arkalon CO2 to OK Fields Industry Cumulative Oil Zone Billion BO Arbuckle 2.3 (37%) L-KC 1.3 (20%) Miss. 1.0 (17%\ Other 1.7 (27%) CO2 Purity 20% 8-12% 99% 99% 65%* Cement Power Ethanol Ammonia Refinery * gasification for desulphurization
Seven Wedges to CO2 reduction Billion of Tons of Carbon Emitted per Year 14 14 GtC/y Currently projected path Geologic Sequestration Wedge O Historical emissions 7 GtC/y 7 Flatpath 1.9 0 2105 1955 2005 2055 Graphic: Socolow & Pacala
Hermanrud, et al. (2009) Compare scale of Arbuckle with Sleipner appx. 3 miles 1999 2001 2002 2004 2006 • Accumulated total reflection amplitude from all nine layers of the Sleipner CO2 plume. • I am not sure how much had been injected in 2006, but as of 2008 ~10 M tons had been injected. • Sleipner project is about the size of some Arbuckle “domes” on the CKU.
Arbuckle EOR and CCS target KGS and TORP (KU) - successful Russell CO2 pilot project (99-09) Kansas CO2 EOR and CCS studies and proposed projects KGS 5-yr DOE-funded study area Coffeyville Fertilizer CAP CO2, Blue Source etal – Phase I DOE study. Two sources, multiple sinks Kansas Ethanol Geneseo-Edwards field could store >8.5 million tons CO2
Arbuckle injection rates and sequestration • Injectivity Documented • 2000 SWDW in Arbuckle in Kansas • 3-5,000 BWPD common; some >10,000 BWPD, on a vacuum. • 100 - 350 metric tons/day, (37 - 130 k metric tons/yr) • 50 -175 injection wells for the planned 850MW Sunflower plant • 1-3 wells for a 55mgy ethanol plant (CO2 properties at 110F and 1100psi – supercritical, 13.8 lbs/ft^3, and 0.22 gm/cc) • Storage space available • A Single Example: Ellsworth anticline (saline aquifer) • 126 square miles (6X21 mi) • 100 ft of closure • 15% porosity • Sw = 100% • Store 278 million metric tons supercritical displacement • 66 million metric tons as dissolved gas • (Assumed 100F, 1200psi, TDS = 30,000 ppm) • Carr, et al. (2005)
Volumetric estimates for storing CO2 in Arbuckle domes on CKU • Kansas: • Total 72.8 Million Metric Tons/Year • Electric Power 37.2Million Metric Tons/Year • New Sunflower 895 MW plant deal – 6.7 million tons/yr (metric tons?) Million Metric Tons * Assumptions: Cumulative oil is ~40% OOIP and 28% of pore volume, FVF = 1.1, Swi = 30%, final Sco2 = 70% and reservoir is filled to spill point. CO2 properties at 110F and 1100psi – supercritical, 13.8 lbs/ft^3, and 0.22 gm/cc.
Theoretical CO2 storage volume in “depleted” Kansas oil and gas reservoirs Filling only the space vacated by the hydrocarbon • Kansas: • Total 72.8 Million Metric Tons/Year • Electric Power 37.2 Million Metric Tons/Year • New Sunflower 895 MW plant deal – 6.7 million tons/yr (metric tons?)
Arbuckle as saline aquifer storage • Positives • Proven seal • Proven injection zone • Vast storage capacity • Fluid gradients working in our favor (Carr, et al.,2005) • Fluid velocities in aquifer are very slow (Jorgensen et al., 1993) • Negatives • Much is below supercritical • Existing wellbores may be problematic • Best structures are still oil productive * • * But….what about concurrent EOR and CCS?
Cost per Ton CO2 ($) Capture 0 - 50 (pure vs. coal-power) Compression 15 - 20 Transportation 0 - 20 (on site vs. distant) Injection & monitor 5 - 10 $20 - $100 per ton Reality of costs Present financial incentive to capture and store: $0 - $20*/ton * $20 tax credit for sequestration for large CO2 sources Interim solution: “Green Oil” 2.8 Barrels of oil recovered ($200 gross value) One ton CO2permanently stored Combust 2.8 Barrels of oil yields 1.1 tons CO2
Melzer, 2009 CO2 Retention in EOR • Historically 50% of CO2 is retained in the reservoir • The other 50% is captured, recycled and re-injected • Eventually nearly all is stored, permanently (<5% loss over time) • Anthro-CO2 oil is nearly carbon neutral* • 7 mcf CO2 sequestered • 8 mcf /barrel oil oxidized • * Excludes, refining, transportation CO2 costs Long-lived CO2 EOR projects, mainly Permian basin
Amount of CO2 sequestered depends on temperature, pressure, brine chemistry, hydrocarbon properties, rock chemistry, and pore throat diameters (capillary pressures) • Modes of storage • Displacement – f(density) = f(P,T) • Residual saturation – f(pores) • Solubility trapping* – f(salinity, P, T) • Mineralization – f(mineralogy, T, brine) CO2 storage capacity and mode Hermanrud, et al. (2009) State of CO2 stored is function of time * Noteworthy: Solubility of CO2 in oil is > than in Sw
Kinder Morgan website Kuuskraa, 2008 • Horizontal (piston) flood • Application: Follow waterfloods • KS targets: L-KC, Bartlesville, Morrow, Chester • Well documented CO2 Processing Styles • Gravity-stable flood • Application: bottom-water drive reservoirs • KS targets: Arbuckle, Simpson, Viola • Fewer analogues
Technical Requirements • Miscible – piston displacement • Inject pressure > CO2 in supercritical state (>1073) • Inject pressure < frac pressure • Reservoir operating pressure > MMP (1200-2000 psi) • Adequate working pressure range (Frac pressure – MMP) • Adequate Remaining OIP • Reservoir conditions allowing contact throughout the reservoir (good waterflood) • Miscible or near-miscible gravity-stable displacement • Same constraints……… • Reservoir BHP above MMP for miscible (for bottom-water drive reservoirs) • Reservoir conditions & wellbore configuration to build uniformly expanding CO2 gas cap
Lansing-KC Hall-Gurney Minimum Miscibility Pressure MMP’s performed by TORP, KU 100 90% Oil Recovery % 50 Pressure MMP Other KS Crudes Recent Arbuckle ~1350 psi MMP = system pressure at which 90% of lease crude oil in sand-packed slim tube is recovered
Kansas Reservoirs (BHP & BHT) • Miscible floods operate at • > supercritical (1073 psi) • above MMP MMP (>1200 psi) • Kansas reservoir properties range: • 400 psi, 85F at 1000 ft • 1600 psi, 125 F at 6000 ft CO2 Phase Diagram Modified after Condren www.cbu.edu/~mcondren/CO2_phase_diagram.jpg
liquid supercritical Inj & Ops Range Properties from SPE Monograph 22 • Target screen dimensions determined by pressure constraints (miscible) • CO2 supercritical at >1073 psi • MMP variable, >1200 psi and increases with BHT (depth) • Frac pressure is upper limit to injection pressure • High absolute maximum operating pressure range is desirable (Delta P = frac P – MMP) CO2’s operating requirements and reservoir constraints Density and viscosity varies significantly from light liquid to heavy super-critical within the range of P & T for surface to BH
Source: IPCC Special Report on Carbon Dioxide Capture and Storage, 2005 1640 ft 3281 ft 4921 ft CO2 volume with depth (P and T) Relative volume for CO2 under “normal” pressure and temperature conditions. Kansas is under-pressured
Pressure constraints (Miscible, Delta P could vary, but generally >300 psi) • Shallowest ~2000 ft (BHP 800 psi) Can work at shallow depths: low BHT lowers MMP and improved frac P with pressured reservoir. • Ideal miscible >4000 ft (BHP 1300 psi) • Large remaining oil in place • “Critical mass” is required to justify non-oil field capital requirements • High ROIP per-acre required to justify oil-field capital requirements • Maximize return on capital Defining Kansas Resource Targets • Gravity-stable targets • High BHP preferred • High gravity, lower MMP preferred • Vertical permeability, layering, coning are complicating factors • Process rate and uniformity • Higher Delta P for higher process rate • Low vertical heterogeneity and good later communication (good sweep efficiency demonstrated by good waterflood)
CO2 EOR impact in Kansas will be significant…. just how significant will be determined by future events. • Carbon management legislation and laws (Cap & Trade) • Geologic storage regulations (Federal and State) • Kansas oil industry response • Plus the usual underlying fundamentals • EOR resource base • Oil price • Favorable / unfavorable tax environment
The CO2 landscape has changed dramatically over the past seven years at the state, regional, and federal level. Convergence CO2 emissions is publicly accepted as a significant issue to be dealt with Looming carbon management legislation and laws (Cap & Trade) would be a game-changer Geologic storage regulations are moving forward (Federal and State) Pure CO2 sources increased 4X in Kansas (3 ethanol plants, 1 ammonia plant and 30 mmcfd to 10 ethanol plants, 2 ammonia plants 120 mmcfd) Technical advancements in CO2 EOR expand targets (gravity-stable, shallower depths, drilling and completion)
Costs for 100 million barrels CO2 EOR oil Capital costs in field $1 Billion CO2 costs** $1 Billion Operating costs $1 Billion Cost of Capital $x Billion ** $1.5/mcf + $0.50/mcf recycle. N/G = 5/10. $30/BO Costs could vary significantly. Numbers are intended only for illustrating that significant investment is required. Kansas Cumulative to date: 6.3 Billion Barrels 20% of P&S: 1.2 Billion KGS upper end technically feasible 600 Million Technically feasible (*ARI): 570 Million More conservative view: 200 Million Half of that: 100 Million(2.5x annual) * Kusskraa (ARI), 2006 Potential CO2 EOR in Kansas (even most conservative view is significant)
140 140 Single-Pt. Seismic 120 120 100 100 3D Seismic Waterfloods WW II Other CO2 80 80 Surface Mapping 60 60 OPEC Price Spike KS CO2 40 40 WW I 20 20 0 0 Impact of Technology on Kansas Oil Production 122 • Technology • Demand (wars) • Oil Price Annual Production (Millions) 40 Rotary Bits 2010 2020 2030 1890 1900 1910 1920 1930 1940 1950 1960 1970 1980 1990 2000
Why not Kansas? Denbury buys Jackson Dome
Kuuskraa, ARI - 2008 Kansas total = 100 mbo/day West Texas CO2 EOR = 175 mbo/day Why not Kansas? • 86 projects • 237 mbo/d O&G Journal 2002, updated by Kuuskraa, 2008 Laws of physics also apply in Kansas
Current CO2 Used for EOR Kuuskraa, ARI - 2008 Kansas currently vents 120 mmcfd of high purity CO2 from Ethanol and Fertilizer plants (EOR potential12-25 mbo/d)
Kansas Strengths and Challenges for CO2 EOR CCS Development Kansas strengths • Significant oil resource base • Well-defined, large sequestration targets • CO2 sources: Local and regional • Head start on regulatory framework • Favorable relationships with research groups (TORP and KGS) • Strong industry and professional groups (KIOGA, KGS (all of them), SPE) • Long-standing intercompany relationships • Skilled workforce • Challenges - Kansas • Resource base – needs to be validated • High % of wells are plugged and many pose a risk to containment • Resources are unconsolidated • Missing CO2 EOR skill sets • Capital • Tendency to be late adopters • Challenges - Federal and State • Philosophical and Regulatory hurdles (CCS vs. EOR) • Regulatory framework still in developmental stage
Kansas Oil’s next generation? 1. Recognize opportunity 2. Understand the challenges 3. Proactive in molding public acceptance and regulatory framework 4. Take the long view, but be early adopters 5. Willingness to collaborate and cooperate END