Download

1 / 12
120 likes | 232 Views
EAS 4480 – Data Analysis James Hite. Investigating Atlanta Area Pollutant Trends. Project Description. Motivation: Census Growth Monitoring Sites (5) Sdekalb , Yorkville Bledsoe, Douglasville , Conyers O 3 , CO , NO x , PM 2.5 Previous Study on VOCs. 2000-2010 Population Change

E N D
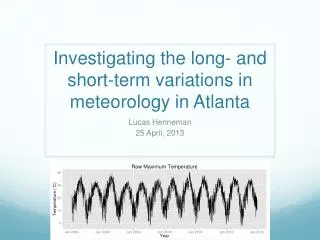
EAS 4480 – Data Analysis James Hite Investigating Atlanta Area Pollutant Trends
Project Description • Motivation: Census Growth • Monitoring Sites (5) • Sdekalb, Yorkville • Bledsoe,Douglasville, Conyers • O3, CO, NOx, PM2.5 • Previous Study on VOCs 2000-2010 Population Change DeKalb: (43,737, 16.7%) Douglas: (16,847, 48.4%) Spaulding: (3,776, 16.4%) Rockdale: (8,190, 32.7%) Paulding: (22,856, 78.1%) Polk: -- (1,849, 14.6%) Haralson: -- (1,568, 12.3%) (expressed in housing units)
Trends in 1-hour averages Method ======= LS Regression, Bootstrap resampling to determine 95% normal confidence interval • Initial Results • Overall Negative Trends - in line with VOC study • Interesting points • Full positive: Conyers, Sdklb O3 • 00-10: none/negative • Motivation for reanalysis (averaging) –diurnal cycle
Trends in Daily/Monthly Avgs. • Overall: increase in negative slopes • Daily: Most retained negative trends except • Full&00-10 Conyers O3 – no trend • Neg/none: Douglasville O3; pos/negSdekalb O3 • Monthly: Less noise less apparent trends • (in addition) Sdekalb O3: no full trend (00-10 less) • No-trends: Bledsoe O3, SdkelabPMfine • 00-10 Yorkville O3 no trend (full still neg.)
Example Figures: Sdekalb O3 10-year loss: -7.20E-03 ppmv (daily) vs-6.77E-03 ppmv (monthly
Changes in Monthly O3 • Linear Trends identified across indv. months • Interesting results: • JFM, ND off-season (Bedsole): positive trends • (other stations don’t really measure at this time) • Conyers Apr. (+), Aug. (-) • Sdekalb Jul./Aug. (-)
Example Figures • Mar., Nov. off-season (Bedsole): positive trends • Conyers : Aug. (-) • Sdekalb: Aug. (-) • Note: other sites have similar slopes, did not pass resampling test for 95% confidence interval • Interesting: less urban areas have higher [March]
Rural v. Urban: Other Pollutants • Yorkville / sdekalbpollutants: all significant trends were negative • PSD/CPSD Analysis • Bedsole plot: • (Lombscargle methodon 1-hr avgs) • … took ~20 minutes
Rural v. Urban • Separate psd analysis @ each station • Cpsd analysis & phase lag • Daily Noxcpsd shows a shared weekly cycle with a lag of ~.5 day (yorksdekalb), would expect this since prevailing wind is easterly (coherence ~.7)
References • Data Source: http://georgiaair.org/amp/export.phpGeorgia Department of Natural Resources, Environmental Protection Division, Air Protection Branch Ambient Monitoring Program - Susan Zimmer-Dauphinee, Program Manager • Blanchard et. al. 2010 • 2009 Ambient Air Surveillance Report