Download
1 / 22
220 likes | 334 Views
Multi-Pollutant AQI Mapping. Anne McWilliams 2007 National Air Quality Conference Orlando, FL February 13, 2007. AQI Scale. =. +. What is a “True AQI” Map?. Ozone, PM 2.5 and PM 10 each have an Air Quality Index scale. A “True AQI” Map depicts the highest or controlling AQI value.

E N D
Multi-Pollutant AQI Mapping Anne McWilliams 2007 National Air Quality Conference Orlando, FL February 13, 2007
AQI Scale = + What is a “True AQI” Map? • Ozone, PM2.5 and PM10 each have an Air Quality Index scale. • A “True AQI” Map depicts the highest or controlling AQI value.
Benefits of a True AQI Map • With a true AQI map, the public has a more accurate picture of the air quality conditions. • Armed with such information, the public can make a more informed decision about behavior modifications they may need to make to protect themselves.
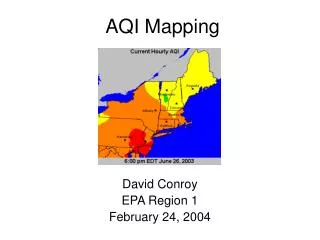
AQI Forecast Current AQI Peak AQI Opportunities for AQI Maps
AQI Forecast Maps On May 3, 2004, the Northeast states produced their first Multi-Pollutant AQI Forecast Map.
How is the Northeast AQI Forecast Map Created? We looked at the distribution of Air Quality Monitors, And chose Forecasting Locations.
To produce the Air Quality forecast map, state forecasters enter an AQI value or category for each pollutant for each forecasting location. The highest AQI values are used for the forecast map.
AQI forecast maps are already being produced on a National scale.
Current Conditions • AIRNow produces a variety of current Ozone and PM2.5 AQI maps based on the applicable surrogate methods. • A current combined AQI map will provide one stop shopping for the Media and the general public.
How would such maps be created? • The first step is to produce hourly AQI contour maps for both ozone and PM2.5 for identical domains. • Hourly AQI maps are generated using the appropriate surrogate method for each pollutant.
How would such maps be created? • Next using MapGen, which is used to produce both the ozone and PM2.5 maps, create hourly gridded AQI data for each pollutant.
What the Gridded Data Looks Like • Each grid cell contains an AQI value Example of a 100 x 100 grid
Using Gridded Data to Produce AQI Maps • By maintaining a constant domain for both the ozone and PM2.5 AQI map, matching grids can be created. • With matching grids, a direct comparison of the data in each grid cell can be made. • A simple logical function can be created which keeps the higher AQI value for each grid cell. • The resulting merged gridded data can then be used to produce a “True AQI” map.
Gridded Ozone AQI data and PM2.5 AQI data are compared to determine the higher AQI Gridded Ozone AQI Data Gridded PM2.5 AQI Data Merged Gridded AQI Data
The result is a true AQI map Air Quality Index
Peak AQI Maps • The creation of Peak AQI Maps follows the same procedure as used for the current AQI maps. • Peak 8-Hour ozone data is blended with the actual 24-Hour PM2.5 AQI.
Why do we need this? • With the expansion of the PM2.5 network, true AQI maps can be generated for many of the domains on AIRNOW. • In order to avoid confusing the public with maps for both ozone and PM2.5, we should move as quickly as possible towards AQI maps where they can be accurately produced. • This is especially critical during the summer months when the predominate pollutant can flip back and forth on many days. • During the winter months in most areas, the PM2.5 map is the AQI map. • Areas with high AQI values for other pollutants (e.g., PM10) can be dealt with on a case-by-case basis. • We need to keep AQI mapping in mind as we enhance our mapping capabilities.