Download
1 / 52
520 likes | 523 Views
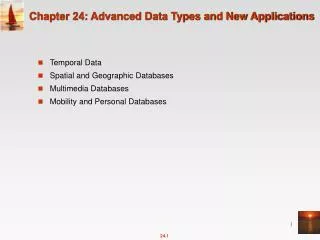
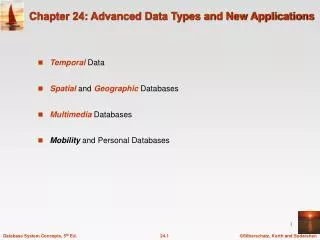
Advanced Data Types and New Applications. These slides are a modified version of the slides of the book “Database System Concepts” (Chapter 24), 5th Ed ., McGraw-Hill , by Silberschatz, Korth and Sudarshan. Original slides are available at www.db-book.com. Temporal Databases.

E N D
Advanced Data Types and New Applications These slides are a modified version of the slides of the book “Database System Concepts” (Chapter 24), 5th Ed., McGraw-Hill, by Silberschatz, Korth and Sudarshan. Original slides are available at www.db-book.com
While most databases tend to model reality at a point in time (at the ``current'' time), temporal databases model the states of the real world across time. In many applications it is important to store and retrieve information about past states (patient data base: medical history of a patient, factory monitoring system: past and current reading from sensors) Databases that store information about states of the real world across time are called temporal databases. Facts in temporal relations have associated times Valid time: denotes the time period during which a fact is true with respect to the real world The transaction time for a fact is the time interval during which the fact is stored within the database system. In a temporal relation, each tuple has an associated time when it is true; the time may be either valid time or transaction time. A bi-temporal relation stores both valid and transaction time. Time In Databases
We record not only changes in what happened at different times, but also changes in what was officially recorded at different times. • Only the transaction time is system dependent and is generated by the database system. Oracle, DB2, ..
Example of a temporal relation: A tuple has only one time interval. A tuple is represented once for every disjoint time interval in which it is true. * in the to column means the tuple is true until the time in the colum is changed Temporal query languages have been proposed to simplify modeling of time as well as time related queries. Time In Databases (Cont.)
Suppose we consider our sample bank database to be bi-temporal. Only the concept of valid time allows the system to answer queries such as - “What was Smith’s balance two days ago?”. • On the other hand, queries such as - “What did we record as Smith’s balance two days ago?” can be answered based on the transaction time. • The difference between the two times is important. For example, suppose, three days ago the teller made a mistake in entering Smith’s balance and corrected the error only yesterday. This error means that there is a difference between the results of the two queries (if both of them are executed today).
date: four digits for the year (1--9999), two digits for the month (1--12), and two digits for the date (1--31). time: two digits for the hour, two digits for the minute, and two digits for the second, plus optional fractional digits. timestamp: the fields of date and time, with six fractional digits for the seconds field. Times are specified in the Universal Coordinated Time, abbreviated UTC (from the French); supports time with time zone (time as local time plus the offset of the local time from UTC). interval: refers to a period of time (e.g., 2 days and 5 hours), without specifying a particular time when this period starts; could more accurately be termed a span. Time Specification in SQL-92
Predicates precedes, overlaps, and contains on time intervals. Intersect can be applied on two intervals, to give a single (possibly empty) interval; the union of two intervals may or may not be a single interval. A snapshotof a temporal relation at time t consists of the tuples that are valid at time t, with the time-interval attributes projected out. Temporal selection: involves time attributes Temporal projection: the tuples in the projection inherit their time-intervals from the tuples in the original relation. Temporal join: the time-interval of a tuple in the result is the intersection of the time-intervals of the tuples from which it is derived. It intersection is empty, tuple is discarded from join. Temporal Query Languages
Functional dependencies must be used with care: adding a time field may invalidate functional dependency A temporal functional dependency x Y holds on a relation schema R if, for all legal instances r of R, all snapshots of r satisfy the functional dependency X Y. SQL:1999 Part 7 (SQL/Temporal) is a proposed extension to SQL:1999 to improve support of temporal data. Temporal Query Languages (Cont.)
Spatial databases store information related to spatial locations, and support efficient storage, indexing and querying of spatial data. Special purpose index structures are important for accessing spatial data, and for processing spatial join queries. Computer Aided Design (CAD) databases store design information about how objects are constructed E.g.: designs of buildings, aircraft, layouts of integrated-circuits Geographic databases store geographic information (e.g., maps). Database for geographic information systems (GIS).(INITIALLY store & retrieve data as files in the file system)(Ability to store and query large amount of data efficiently) Spatial Databases
Various geometric constructs can be represented in a database in a normalized fashion. Represent a line segment by the coordinates of its endpoints. Approximate a curve by partitioning it into a sequence of segments Create a list of vertices in order, or Represent each segment as a separate tuple that also carries with it the identifier of the curve (2D features such as roads). Closed polygons List of vertices in order, starting vertex is the same as the ending vertex, or Represent boundary edges as separate tuples, with each containing identifier of the polygon, or Use triangulation — divide polygon into triangles Note the polygon identifier with each of its triangles. Represented of Geometric Information
Representation of points and line segment in 3-D similar to 2-D, except that points have an extra z component Represent arbitrary polyhedra by dividing them into tetrahedrons, like triangulating polygons. Alternative: …… Representation of Geometric Information (Cont.)
Represent design components as objects (generally geometric objects); the connections between the objects indicate how the design is structured. Simple two-dimensional objects: points, lines, triangles, rectangles, polygons. Complex two-dimensional objects: formed from simple objects via union, intersection, and difference operations. Complex three-dimensional objects: formed from simpler objects such as spheres, cylinders, and cuboids, by union, intersection, and difference operations. Wireframe models represent three-dimensional surfaces as a set of simpler objects.Wireframing is one of the method of geometric modelling system. A wireframe model represents shape of solid object by its characteristics links and points Design Databases
Design databases also store non-spatial information about objects (e.g., construction material, color, etc.) Spatial integrity constraints are important. E.g., pipes should not intersect, wires should not be too close to each other, etc. Representation of Geometric Constructs (a) Difference of cylinders (b) Union of cylinders
Geographic dataExamples of geographic data map data for vehicle navigation distribution network information for power, telephones, water supply, and sewage Vehicle navigation systems store information about roads and services for the use of drivers: Spatial data: e.g, road/restaurant/gas-station coordinates Non-spatial data: e.g., one-way streets, speed limits, traffic congestion Global Positioning System (GPS) unit - utilizes information broadcast from GPS satellites to find the current location of user with an accuracy of tens of meters. increasingly used in vehicle navigation systems as well as utility maintenance applications. Applications of Geographic Data
Geographic Information System A geographic information system (GIS) is a system designed to capture, store, manipulate, analyze, manage, and present all types of geographic information for decision making In developing a digital topographic data base for a GIS, topographical maps are the main source, and aerial photography and satellite images are extra sources for collecting data and identifying attributes which can be mapped in layers. GIS applications are tools that allow users to create interactive queries (user-created searches), analyze spatial information, edit data in maps, and present the results of all these operations.
Example Each point is an earthquake area Each point is a record in tha table with different attributes: - earthquake deph - earthquake magnitude - some attributes that denote properties of the object: colour, shape, symbol Sometimes table analysis not allow to find correlations between phisycal phenomena Geographical distribution of earthquakes
GIS organize information in individual data themes that describe the distribution of a phenomenon across a geographic extent. This organizing principle of geographic layers became one of the universal GIS principles that provided the foundation for how GIS systems represent, operate on, manage, and apply geographic information. There are two broad methods used to store data in a GIS : raster images and vectors. Thematic layers
Raster data consist of bit maps or pixel maps, in two or more dimensions. Example 2-D raster image: satellite image of cloud cover, where each pixel stores the cloud visibility in a particular area. Additional dimensions might include the temperature at different altitudes at different regions, or measurements taken at different points in time. Design databases generally do not store raster data. Geographic Data
Raster data • a matrix of cells (or pixels) organized into rows and columns (a grid), as shown in the graphic below, where each cell contains a value representing information of the geographic feature at the cell location, such as land-use. Raster image: digital aerial photographs, imagery from satellites, digital pictures, or even scanned maps.
Raster data set Raster attribute table There is a row for each distinct value in the data set.A column contains the count of the number of cells with each value. This table may also have a column that provides a textual description of each of the values in the data set. There are three default fields created in thetable: • ObjectID (OID) is a unique system-defined object identifier number for each row • - VALUE is a value in the raster data set. • COUNTrepresents the number of cells in the raster data set with the cell value in the VALUEcolumn. • Cell values represented by NoData are not in the raster attribute table.
The cell size determines how coarse or fine the patterns or features in the raster will appear. The smaller the cell size, the smoother or more detailed the raster will be. However, the greater the number of cells, the longer it will take to process, and it will increase the demand for storage space. If a cell size is too large, information may be lost or subtle patterns may be obscured.
Vector data are constructed from basic geometric objects: points, line segments, triangles, and other polygons in two dimensions, and cylinders, spheres, cuboids, and other polyhedrons in three dimensions. Vector format are often used to represent map data. Roads can be considered as two-dimensional and represented by lines and curves (multiple line segments). Some features, such as rivers, may be represented either as complex curves or as complex polygons, depending on whether their width is relevant. Features such as regions and lakes can be depicted as polygons. Topological information , such as height, may be represented by a surface divided into polygons covering regions of equal height (a height value associated with each polygon) Geographic Data (Cont.)
Vector data • Point Each point is stored by its location (X, Y) together with the table attribute of this point. For example, 4 points below have their coordinate location in (X, Y) and each point has attributes of deep and amount of water contamination.
Line Each line is stored by the sequence of first and last point together with the associated table attribute of this line. For example, three lines below (a, b and c) have their first and last node to distinguish their location and each line has attributes of flow and capacity of the sewerage pipe. Notice that each node has coordinate (X, Y) that is stored in another table.
Polygon Polygon is represented by a closed sequence of lines. Unlike line or poly-line (sequence of line), polygon always closed. That is, the first point is equal to the last point. A polygon can be represented by a sequence of nodes where the last node is equal to the first node. For example, polygon A below has its first and last node in node number 1 to settle its location. Aside from location attributes, the polygon has associated attributes of area and population. • Notice that each node has coordinate (X, Y) that is stored in another table.
A number of types of query involve spatial locations Nearness queries request objects that lie near a specified location.Find all restaurants that lie within a given distance Nearest neighbor queries, given a point or an object, find the nearest object that satisfies given conditions.The nearest gasoline station Region queries deal with spatial regions. e.g., ask for objects that lie partially or fully inside a specified region.All markets within the boundaries of a given town. Queries that compute intersections or unions of regions.All regions with a low annual rainfall and a high population density.They use Spatial join of two spatial relations with the location playing the role of join attribute (one relation representing rainfall, the other relation population density). Spatial Queries
Spatial data is typically queried using a graphical query language; results are also displayed in a graphical manner. Graphical interface constitutes the front-end Extensions of SQL with abstract data types, such as lines, polygons and bit maps, have been proposed to interface with back-end. allows relational databases to store and retrieve spatial information Queries can use spatial conditions (e.g. contains or overlaps). queries can mix spatial and nonspatial conditions (the nearest restaurant that has vegetarian selection and thatcharges less than $10 for a meal) Spatial Queries (Cont.)
Indices are required for efficientaccess to spatial data. • Queriesoftenaccess data in a region of the space • The problemis: how the space can be partitionedintoregionssuchthatallrecords in the region can be stored in a block? Traditionalindexstructuressuchashashindices and B-trees are notsuitable, sincethey deal only with one-dimensional data, wherespatial data are typically of two or more dimensions
k-d tree - early structure used for indexing in multiple dimensions(balanced binary tree). Each level of a k-d tree partitions the space into two. choose one dimension for partitioning at the root level of the tree. choose another dimensions for partitioning in nodes at the next level and so on, cycling through the dimensions. In each node, approximately half of the points stored in the sub-tree fall on one side and half on the other. Partitioning stops when a node has less than a given maximum number of points. The k-d-B tree extends the k-d tree to allow multiple child nodes for each internal node; well-suited for secondary storage. Indexing of Spatial Data
Each line in the figure (other than the outside box) corresponds to a node in the k-d tree the maximum number of points in a leaf node has been set to 1. The numbering of the lines in the figure indicates the level of the tree at which the corresponding node appears. K-d-B tree extends the number of children (to reduce the high of the tree) of internal nodes Division of Space by a k-d Tree Cities(Name, Latitude, Longitude) A … … B … … C … … D … … E … … F … … G … … H … … C A B F D E G H
Division of Space by a k-d Tree C A B F D E 1 G H Latitude 2 2 Longitude • number of cities in a block set to 1 3 3 3 3 Latitude • half of the cities on one side and half on the other E B H D F A G C
Division of Space by a k-d Tree C A B F D E G H 1 Latitude • number of cities in a block set to 2 2 2 Longitude • half of the cities on one side and half on the other G,H C,F A,B D,E Block Cities located in the same region are stored in the same block
Quadtrees Each node of a quadtree is associated with a rectangular region of space; the top node is associated with the entire target space. Each non-leaf nodes divides its region into four equal sized quadrants correspondingly each such node has four child nodes corresponding to the four quadrants and so on Leaf nodes have between zero and some fixed maximum number of points (set to 1 in example). This type of quadtree is called Point Region quadtree (PR quadtree) Division of Space by Quadtrees C A B PR quadtree: stores points; space is divided based on regions, rather than on the actual set of points stored (four equal sized quadrants). F D E H G
PR quadtree C A NO NE B SO SE quadrants are namedaccording to the geographycal position and are listed in theorder NE, NO, SO and SE F D PR quadtree E H G SE SO NO NE NE SO SE NO NE NE SO SE NO A SO SE NO D E F NE SO SE NE NO H SO SE NO C G B
Region quadtrees store raster information. A node is a leaf node if all the values in the cells that it covers are the same. Otherwise, it is subdivided further into four children of equal area, and is therefore an internal node. Each node corresponds to a matrix of cells. The matrix corresponding to leaves either contain just a single element (cell), or have multiple elements (cells), all of which have the same value. Quadtrees (Cont.) We can use Region quadtree to store raster information
Raster data < to be done>
Indexing of line segments and polygons presents new problems Extensions of k-d trees and PR quadtrees have been proposed to index line segments and polygons However, a line segment or polygon may cross a partitioning line This requires splitting segments/polygons into pieces at partitioning boundaries and they must be represented in each of the sub-trees in which its pieces occur. Same segment/polygon may be represented at several leaf nodes-> inefficiencies in storage and inefficiencies in queries Quadtrees (Cont.)
Indexing of objects such as line segments, rectangles, and other polygons R-trees (Rectangle-trees) are a N-dimensional extension of B+-trees. Basic idea: generalize the notion of a one-dimensional interval associated with each B+ -tree node to an N-dimensional interval, that is, an N-dimensional rectangle. Balanced tree structure with indexed objects in leaf nodes. The storage efficiency of R-trees is better than that of k-d trees or quadtrees since a polygon is stored only once Will consider only the two-dimensional case (N = 2) generalization for N > 2 is straightforward, although R-trees work well only for relatively small N R-Trees Example of B+-tree file
A rectangular bounding box is associated with each tree node. Bounding box of a leaf node is a minimum sized rectangle parallel to the axes that contains all objects (lines, rectangles, polygons) associated with the leaf node. The bounding box associated with a non-leaf node is the smallest rectangle parallel to the axes that contains the bounding box associated with all its children. Bounding box of a node serves as its key in its parent node (if any) Bounding boxes of children of a node are allowed to overlap A polygon is stored only in one node, and the bounding box of the node must contain the polygon R Trees (Cont.)
A set of rectangles (solid line) and the bounding boxes (dashed line) of the nodes of an R-tree for a set of rectangles. The R-tree is shown on the right. Example R-Tree leaf nodes Bounding boxes are shown with extra space inside them, to make them stand out We shall see how to implement search, insert and delete operations on an R-tree If indexed objects are not rectangles, we can store bounding boxes of objects in leaves. This helps to speed up checks for overlaps in a query.
Point queries select * from … where latitude = …. AND longitude = …. Region queries select * from … where v1 <= latitude <= v2 AND w1 <= longitude <= w2 Nearest-neighbor queries nearest point to a specific location Partial match queries select * from … where v1 <= latitude <= v2 Queries
A search for objects containing a point has to follow all child nodes whose associated bounding boxes contain the point. To find data items (rectangles/polygons) intersecting (overlaps) a given query object (point/region), do the following, starting from the root node: If the node is a leaf node, output the data items whose keys intersect the given query object (point/region). Else, for each child of the current node whose bounding box overlaps the query object (point/region), recursively search the child Can be very inefficient in worst case since multiple paths may need to be searched but works acceptably in practice. Search in R-Trees
Insertion in R-Trees • To insert a data item (single traversal down from the root): • Find a leaf to store it, and add it to the leaf • To find leaf, follow a child (if any) whose bounding box contains bounding box of data item • At each internal node, we may find multiple children whose bounding boxes contain the bounding box of the object • The R-tree algorithm chooses one of them arbitrarily • In none of the children satisfy this condition, chooses a child whose overlap with data item bounding box is maximum for continuing the traversal of the tree • Once the leaf node has been reached, if the node is already full, the algorithm performs node splitting
Insertion in R-Trees • Handle overflows by splitting and propagates splitting upwards if required (as in B+ -trees) • The R-tree insertion ensures that the tree remains balanced • Adjust bounding boxes such that they remain consistent:bounding boxes of leaves contains all the bounding boxes of the objects stored at the leaf;bounding boxes of internal nodes contain all bounding boxes of the children nodes The main difference with B+-tree is in how the node is split: in B+-tree it is possible to find a value such that half entries are less and half entries are greater than the value. in two dimensions, it is not always possible to split the entries into two sets so that their bounding boxes do not overlap
Split procedure • Split procedure: • Goal: divide the set S of entries of an overfull node into two sets S1 and S2 such that the bounding boxes of S1 and S2 have minimum total area. This is a heuristic. • Alternative: divide the set S of entries of an overfull node into two sets S1 and S2 such that the bounding boxes of S1 and S2 have the minimum overlap • Finding the “best” split (minimum total area or minimum overlap) is expensive • Cheaper heuristics such as quadratic split are used