Download
1 / 42
420 likes | 540 Views
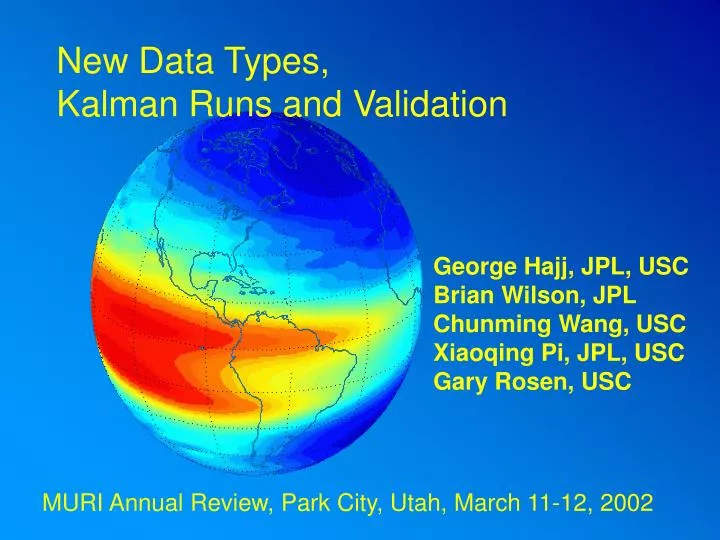
New Data Types, Kalman Runs and Validation. George Hajj, JPL, USC Brian Wilson, JPL Chunming Wang, USC Xiaoqing Pi, JPL, USC Gary Rosen, USC. MURI Annual Review, Park City, Utah, March 11-12, 2002. Outline. Data types assimilated to date: Ground TEC Space TEC (Occultations and upward)

E N D
New Data Types, Kalman Runs and Validation George Hajj, JPL, USC Brian Wilson, JPL Chunming Wang, USC Xiaoqing Pi, JPL, USC Gary Rosen, USC MURI Annual Review, Park City, Utah, March 11-12, 2002
Outline • Data types assimilated to date: • Ground TEC • Space TEC (Occultations and upward) • Amplitude Measurements and Diffraction Tomograhy • EUV radiances (1356 Å) • GPS occultation missions • Diffraction Tomography • Runs for Oct. 10, 2002 • Data Non-linearity (EUV) • Validation • Ground TEC • TOPEX • EUV Independent Retrievals from NRL
Summary of Ground TEC Data • Absolute TEC from 100+ Global GPS Ground Stations • Several regional networks of 1000+ stations exist • Thus far, ground TEC has been used as the main source of data and validation for GAIM • GAIM assimilates ~170,000 TEC links (@ 5 min rate) per day • 24 hour run takes 2-20 hours (on a single processor) using the Band-Limited Kalman filter • Run time depends on the degree of correlation maintained between the model elements
Correlation Scale Band Limited Kalman sij = Corr. between voxel i and j si = Uncertainty in density in voxel i R = Correlation length in altitude Q = Correlation length in latitude F = Correlation length in longitude
Summary of Space TEC Data • TEC change from occultations and upward looking • Missions collecting GPS data from space • CHAMP (@ 440 km) • SAC-C (@ 700 km) • IOX (@ 800 km) • TOPEX (@1330 km) • Jason-1 (@1330 km) • GRACE (@ 350 km) • Occultation links per antenna per day: 150,000 (@ 1 sec. rate) (up to 2 antennas per satellite, fore&aft) • Upward looking data points per day: 70,000 (@ 10 sec. rate)
CHAMP (Aug-2-2001) CHAMP (Oct-2-2001) SAC-C IOX (Nov-23-2001) IOX (Nov-31-2001) ARGOS 80 60 40 20 0 -20 -40 -60 -80 Latitude 0 5 10 15 20 Local Time, hr Orbits Overlaps
Dual Frequency GPS Receiver Similar to GPS-Met/SunSat/Oersted Codeless processing of L2 signal Patch Antenna Oriented to Face Anti-Ram Obtains setting occultations Simultaneous Observations of up to 8 GPS Satellites Data Obtained L1/L2 carrier phase L1/L2 pseudorange C/A & P2 SNRs Variable Data Rates 0.1 Hz: non-occulting satellites (“Low Rate”) 1.0 Hz: ionospheric occultations (“Medium Rate”) 50 Hz: stratosphere/troposphere (“High Rate”) IOX Characteristics Paul Straus IOX Early Results (MURI) March 11, 2002
IOX Sensor GPS Receiver Interface Card Patch Antenna Low Noise Amplifier SSTL Module Box Paul Straus IOX Early Results (MURI) March 11, 2002
29 September Launch 11 October IOX I/F Tests 12 October IOX Receiver Power On I/F - S/C communications anomaly S/C attitude trouble Receiver reboots 19 October S/C attitude improved 26 October Communications bug fixed 9 November IOX Receiver On Again S/C downlink interference problem diagnosed Receiver reboot problem does not reappear IOX Operations Timeline (1 of 2) Paul Straus IOX Early Results (MURI) March 11, 2002
22 November Interference work-around implemented Low rate data collection starts 26 November Medium rate data collection starts 12 December High rate test 02 January 2002 Medium rate data below ~100 km Fixed I/F Card software bug that suppressed this data IOX Operations Timeline (2 of 2) Paul Straus IOX Early Results (MURI) March 11, 2002
Differential Pseudorange Differential Phase C/A SNR 10 P2 SNR 0.1 Hz 1.0 Hz SZA 90° 100° Limb TEC Profile Retrieved Profile (Abel Inversion) Occultation TP Differential Pseudorange Differential Phase Satellite Track Paul Straus
Differential Pseudorange Differential Phase C/A SNR 10 P2 SNR Limb TEC Profile Retrieved Profile (Abel Inversion) Differential Pseudorange Differential Phase Paul Straus
Differential Pseudorange Differential Phase C/A SNR 10 P2 SNR Retrieved Profile (Abel Inversion) Limb TEC Profile Differential Pseudorange Differential Phase Paul Straus
Differential Pseudorange Differential Phase C/A SNR 10 P2 SNR Limb TEC Profile Retrieved Profile (Abel Inversion) Differential Pseudorange Differential Phase Paul Straus
Add Another Orbit January 5, 2002 ~0400 UT Paul Straus IOX Early Results (MURI) March 11, 2002
GPS Signal Amplitude Data Signal Amplitude During a GPS/SAC-C Occultation
Spectral Representation of Occultation Data Sporadic Es 2-sec sliding spectrum of the complex (phase & amplitude) GPS Signal of a SAC/C Occultation collected at 100 Hz. The spectrum reveals the sporadic Es.
The Ewald’s Limiting Sphere The Ewald’s sphere associated with the incident wave vector k0S0. The Ewald’s limiting sphere is the envelope of the spheres associated with all possible wave vectors and its interior.
EUV AIRGLOW DATA • NRL provided USC data from LORAAS on Oct. 2000 • Data contained • Calibrated radiances at 1356 Å for night time scans • Error associated with each measurement • Satellite orbit in inertial frame • Electron density retrievals • Processing at USC included: • Reformatting of data • Transformation to earth fixed • Assimilation of radiances • Comparisons to NRL electron density retrievals
LORASS Radiances vs. Assigned Uncertainty From October, 3rd, 2000
Handling EUV Data in the Kalman Filter Kalman Filter Modeling the Measurement
LORASS Radiance Measurements: Observed .vs. Computed From October, 3rd, 2000 Observed vs. Computed Based on GAIM Climatology Linear fit
Observed Minus Computed Radiances (OMC) OMC based on GAIM analysis (after 1 iteration) OMC based on GAIM analysis (after 1 iteration) OMC based on GAIM climate n = 14963 avg = -1.3 s.d. = 19. 2 min = -137.2 max = 159.1 rms = 19.2 n = 14963 avg = -1.0 s.d. = 13.6 min = -86.5 max = 113.2 rms = 13.7 n = 14963 avg = -29.9 s.d. = 70.9 min = -327.7 max = 321 rms = 76.9
11th orbit on 10/03/2000 EUV 2D Retrieval GAIM Climate GAIM w/ GPS GAIM w/ EUV