Download
1 / 26
260 likes | 410 Views
Hypothesis Tests. BUAD820 Chapters 9. Problem #1: Quality improvement and salad dressings.

E N D
Hypothesis Tests BUAD820 Chapters 9
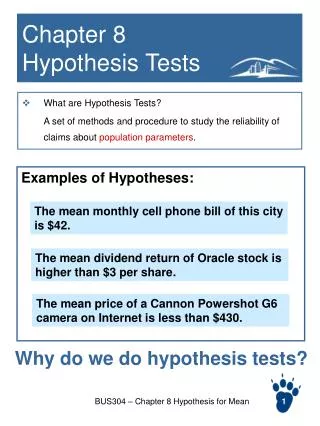
Problem #1: Quality improvement and salad dressings • A manufacturer of salad dressings uses machines to dispense liquid ingredients into bottles that move along a filling line. The machine that dispenses the dressings is working properly when 8 ounces are dispensed. The standard deviation of the process is 0.15 ounces. A sample of 50 bottles is selected periodically, and the filling line is stopped if there is evidence that the mean amount dispensed is different from 8 ounces. Suppose the mean amount dispensed for a sample of 50 bottles was 7.983 ounces – does this provide evidence that the population average amount dispensed is different from 8 ounces? • Clearly state the hypothesis and the conclusion at a=0.05. Be sure to report a p-value
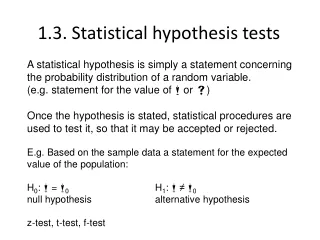
Problem #1: Hypothesis statement and test type • 2-tailed Z test because population standard deviation is known
Problem #1: Critical values and decision = .05/2 = .05/2 Reject H0 if Z < -1.96 or Z > 1.96; otherwise do not reject H0 Reject H0 Do not reject H0 Reject H0 -Z= -1.96 0 +Z= +1.96 Here, Z = -0.8 > -1.96, so the test statistic is in the non-rejection region. Thus we cannot reject the null (m=8)
Problem#1: p-Value • Question:How likely is it to see a sample mean of 7.983 if the true mean is = 8? X = 7.983 is translated to a Z score of Z = -0.8 /2 = .025 /2 = .025 .2119 .2119 p-value =.2119 + .2119 = .4238 -1.96 0 1.96 Z -0.80 0.80
Problem #2: QC @ Dim Bulbs • The QC manager at a light bulb factory needs to determine whether the mean life of a large shipment is equal to the advertised value of 375 hours. The process standard deviation is known to be 100 hours. A random sample of 64 light bulbs indicates a sample mean life of 350 hours • Clearly state the hypothesis and the conclusion at a=0.05. Be sure to report a p-value
Problem #2: Hypothesis statement and test type • 2-tailed Z test because population standard deviation is known
Problem #2: Critical values and decision = .05/2 = .05/2 Reject H0 if Z < -1.96 or Z > 1.96; otherwise do not reject H0 Reject H0 Do not reject H0 Reject H0 -Z= -1.96 0 +Z= +1.96 Here, Z = -2.0 < -1.96, so the test statistic is in the rejection region. Thus we reject the null which states that mean life = 375
Problem#2: p-Value • Question:How likely is it to see a sample mean of 350 if the true mean is = 375? X = 350 is translated to a Z score of Z = -2.0 /2 = .025 /2 = .025 .0228 .0228 p-value =.0228 + .0228 = .0456 -1.96 0 1.96 Z -2.0 2.0
Problem #3: Quality improvement at a local newspaper • The operations manager for a local newspaper is assessing how well their company’s quality improvement program is working. One objective of this program is to reduce the proportion of newspapers that have nonconformities such as excessive rub-off, improper page setup, missing pages, and duplicate pages. Past data showed that as many as 20% of newspapers contained such nonconformities. To determine whether this proportion has reduced, she takes a random sample of 200 newspapers for this purpose, and finds that 35 contain some type of nonconformity. What conclusion will she reach given this data? • Clearly state the hypothesis and the conclusion at a=0.05. Be sure to report a p-value
Problem #3: Hypothesis statement and test type • Z test; 1-tailed because the manager wants to test whether proportion of errors has reduced
Problem #3: Critical values and decision = .05 Reject H0 if Z < -1.645; otherwise do not reject H0 Reject H0 Do not reject H0 -Z= -1.645 0 Here, Z = -0.88 > -1.645, so the test statistic is in the non-rejection region. Thus we do not reject the null which states that error rate has reduced from 20%
Problem #3: p-value • Question:How likely is it to see a sample proportion of 0.175 if the true proportion is 0.2? 0.1894 = .05 Reject H0 Do not reject H0 -Z= -1.645 0 -0.88
Problem #4: Market Survey Analysis • Apple Tree Supermarkets is considering opening a new store at a certain location, but wants to know if average weekly sales will exceed $25,000. Apple Tree estimates weekly gross sales at nearby stores by sending field workers to collect observations. The field workers collect 40 samples and arrive at a sample mean of $26,359, and a standard deviation of $4,200. Does this data provide evidence that the cut-off will be met (i.e. average weekly sales will exceed $25,000)? • Clearly state the hypothesis and the conclusion at a=0.05. Be sure to report a p-value
Problem #4: Hypothesis statement and test type • 1-tailed t test because population standard deviation is unknown, and sample is “small”
Problem #4: Critical value and decision Reject H0 t with 39 degrees of freedom and 5% area in right tail =1.6849 (see Table E.3) = . 05 Do not reject H0 Reject H0 1.6849 0 t = 2.046 Reject H0 since t = 2.046 > 1.6849 i.e.: Sample evidence suggests that average weekly sales will exceed $25,000
Problem#4: p-Value • Calculated t=2.046, with 39 degrees of freedom • Looking in the row with 39 degrees of freedom, the value 2.046 falls between 2.0227 (a=0.025) and 2.4258 (a=0.01) • P-value for this hypothesis test is between 1% and 2.5%
Problem #5: Rogaine • Results published by the Upjohn Corporation on the effectiveness of Rogaine on hair growth in men after 4 months of use are given below: • Rogaine would like to use the hypothesis test so as to claim that over 50% of men who use the product can be expected show minimal to dense hair growth.
Extra Problem: Data check & Hypothesis statement Rogaine would like to use hypothesis test to claim that over 50% of men who use the product can be expected show minimal to dense hair growth. Check: np = (712)(.5) = 356 n(1-p) = (712)(.5) = 356 So, we should use Z-test
Extra Problem: Test statistic Includes people experiencing minimal, moderate and dense growth: (232+180+5=417) Test Statistic:
Extra Problem: Decision 4.57 Conclusion: Decision: Sample evidence suggests that more than 50% users will experience some hair growth Reject H0 at = .05
Extra Problem: p-value? • Z=4.57, but that value is not in the tables • The closest entry is for 4.50, and the area is 0.999996602 • Thus p-value should be smaller than 1-0.999996602, or pretty close to 0 • Reporting p-value = 0 is acceptable in this and such cases