Download
1 / 1
10 likes | 132 Views
Experimental field trial. Maize Grain sampling from experimental fields. Physiological data recording. Sugar and starch ethanolic extraction of maize grain samples, 20 mg. Incubate in thermomixer at 80°C and centrifuge for 5 min, 6000 rpm, 0°C.

E N D
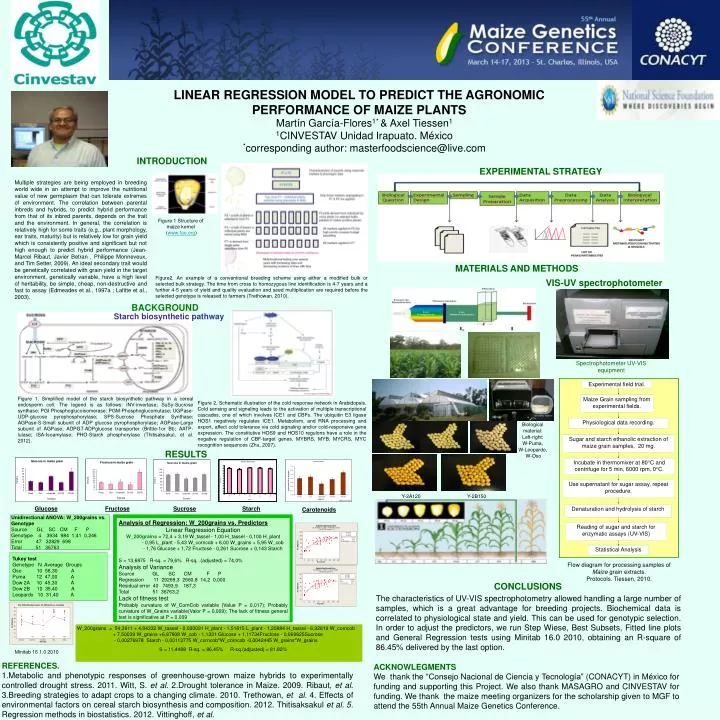
Experimental field trial. Maize Grain sampling from experimental fields. Physiological data recording. Sugar and starch ethanolic extraction of maize grain samples, 20 mg. Incubate in thermomixer at 80°C and centrifuge for 5 min, 6000 rpm, 0°C. Use supernatant for sugar assay, repeat procedure. Denaturation and hydrolysis of starch Reading of sugar and starch for enzymatic assays (UV-VIS) Statistical Analysis LINEAR REGRESSION MODEL TO PREDICT THE AGRONOMIC PERFORMANCE OF MAIZE PLANTS Martín García-Flores1* & Axel Tiessen1 1CINVESTAV Unidad Irapuato. México *corresponding author: masterfoodscience@live.com INTRODUCTION EXPERIMENTAL STRATEGY Multiple strategies are being employed in breeding world wide in an attempt to improve the nutritional value of new germplasm that can tolerate extremes of environment. The correlation between parental inbreds and hybrids, to predict hybrid performance from that of its inbred parents, depends on the trait and the environment. In general, the correlation is relatively high for some traits (e.g., plant morphology, ear traits, maturity) but is relatively low for grain yield which is consistently positive and significant but not high enough to predict hybrid performance (Jean-Marcel Ribaut, Javier Betran , Philippe Monneveux, and Tim Setter, 2009). An ideal secondary trait would be genetically correlated with grain yield in the target environment, genetically variable, have a high level of heritability, be simple, cheap, non-destructive and fast to assay (Edmeades et al., 1997a ; Lafitte et al., 2003). Figure 1 Structure of maize kernel (www.fao.org) MATERIALS AND METHODS Figure2. An example of a conventional breeding scheme using either a modified bulk or selected bulk strategy. The time from cross to homozygous line identification is 4-7 years and a further 4-5 years of yield and quality evaluation and seed multiplication are required before the selected genotype is released to farmers (Trethowan, 2010). VIS-UV spectrophotometer BACKGROUND Starch biosynthetic pathway Spectrophotometer UV-VIS equipment Figure 1. Simplified model of the starch biosynthetic pathway in a cereal endosperm cell. The legend is as follows: INV-invertase; SuSy-Sucrose synthase; PGI Phosphoglucoisomerase; PGM-Phosphoglucomutase; UGPase-UDP-glucose pyrophosphorylase; SPS-Sucrose Phosphate Synthase; AGPase-S-Small subunit of ADP glucose pyrophosphorylase; AGPase-Large subunit of AGPase; ADPGT-ADPglucose transporter (Brittle-1or Bt); AATP-lulase; ISA-Isoamylase; PHO-Starch phosphorylase (Thitisaksakul, et al. 2012). Figure 2. Schematic illustration of the cold response network in Arabidopsis. Cold sensing and signaling leads to the activation of multiple transcriptional cascades, one of which involves ICE1 and CBFs. The ubiquitin E3 ligase HOS1 negatively regulates ICE1. Metabolism, and RNA processing and export, affect cold tolerance via cold signaling and/or cold-responsive gene expression. The constitutive HOS9 and HOS10 regulons have a role in the negative regulation of CBF-target genes. MYBRS, MYB; MYCRS, MYC recognition sequences (Zhu, 2007). Biological material: Left-right: W-Puma, W-Leopardo, W-Oso RESULTS Y-2A120 Y-2B150 Glucose Fructose Sucrose Starch Carotenoids Unidirectional ANOVA: W_200grains vs. Genotype Source GL SC CM F P Genotype 4 3934 984 1,41 0,246 Error 47 32829 698 Total 51 36763 Analysis of Regression: W_200grains vs. Predictors Linear Regression Equation W_200grains = 72,4 + 3,19 W_tassel - 1,00 H_tassel - 0,100 H_plant - 0,95 L_plant - 5,43 W_corncob + 6,00 W_grains + 5,95 W_cob - 1,76 Glucose + 1,72 Fructose - 0,261 Sucrose + 0,143 Starch S = 13,6875 R-sq. = 79,6% R-sq. .(adjusted) = 74,0% Analysis of Variance Source GL SC CM F P Regression 11 29269,3 2660,8 14,2 0,000 Residual error 40 7493,9 187,3 Total 51 36763,2 Lack of fitness test Probably curvature of W_CornCob variable (Value P = 0,017); Probably curvature of W_Grains variable(Valor P = 0,009); The lack of fitness general test is significative at P = 0,009 Tukey test Genotype N Average Groups Oso 10 56,30 A Puma 12 47,00 A Dow 2A 10 45,30 A Dow 2B 10 35,40 A Leopardo 10 31,40 A Flow diagram for processing samples of Maize grain extracts. Protocols. Tiessen, 2010. CONCLUSIONS The characteristics of UV-VIS spectrophotometry allowed handling a large number of samples, which is a great advantage for breeding projects. Biochemical data is correlated to physiological state and yield. This can be used for genotypic selection. In order to adjust the predictors, we run Step Wiese, Best Subsets, Fitted line plots and General Regression tests using Minitab 16.0 2010, obtaining an R-square of 86.45% delivered by the last option. W_200grains = 54,3911 + 4,94332 W_tassel - 0,030091 H_plant - 1,51615 L_plant - 1,20884 H_tassel - 6,32619 W_corncob + 7,50039 W_grains +6,87808 W_cob - 1,1331 Glucose + 1,11734Fructose - 0,069625Sucrose - 0,00276978 Starch - 0,00113775 W_corncob*W_corncob -0,0042445 W_grains*W_grains S = 11,4488 R-sq. = 86,45% R-sq.(adjusted) = 81,82% Minitab 16 1.0 2010 REFERENCES. 1.Metabolic and phenotypic responses of greenhouse-grown maize hybrids to experimentally controlled drought stress. 2011. Witt, S. et al. 2.Drought tolerance in Maize. 2009. Ribaut, et al. 3.Breeding strategies to adapt crops to a changing climate. 2010. Trethowan, et al.4. Effects of environmental factors on cereal starch biosynthesis and composition. 2012. Thitisaksakul et al. 5. Regression methods in biostatistics. 2012. Vittinghoff, et al. ACKNOWLEGMENTS We thank the “Consejo Nacional de Ciencia y Tecnología” (CONACYT) in México for funding and supporting this Project. We also thank MASAGRO and CINVESTAV for funding. We thank the maize meeting organizers for the scholarship given to MGF to attend the 55th Annual Maize Genetics Conference.