Download
1 / 12
120 likes | 211 Views
The Simple Linear Regression Model. Simple Linear Regression Model y = 0 + 1 x + Simple Linear Regression Equation E( y ) = 0 + 1 x Estimated Simple Linear Regression Equation y = b 0 + b 1 x. ^. Least Squares Method. Least Squares Criterion where:

E N D
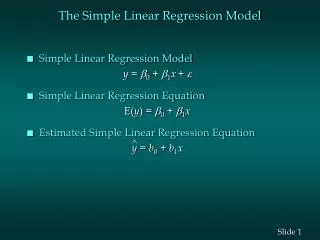
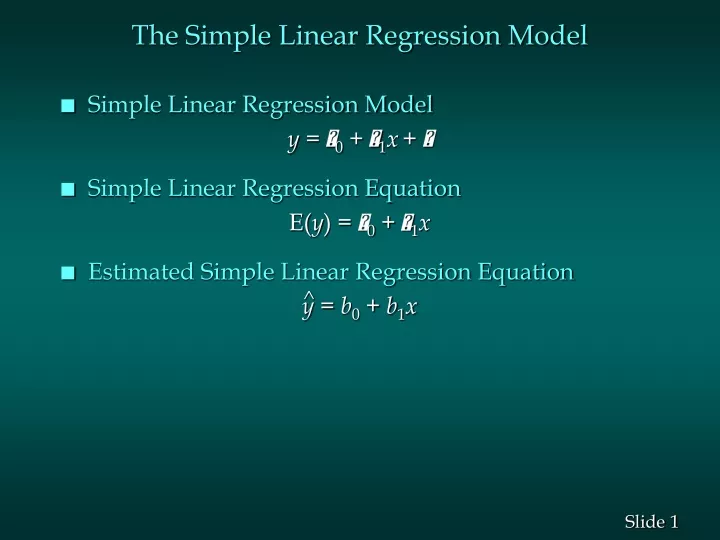
The Simple Linear Regression Model • Simple Linear Regression Model y = 0 + 1x+ • Simple Linear Regression Equation E(y) = 0 + 1x • Estimated Simple Linear Regression Equation y = b0 + b1x ^
Least Squares Method • Least Squares Criterion where: yi = observed value of the dependent variable for the ith observation yi = estimated value of the dependent variable for the ith observation ^
^ ^ The Coefficient of Determination • Relationship Among SST, SSR, SSE SST = SSR + SSE • Coefficient of Determination r2 = SSR/SST where: SST = total sum of squares SSR = sum of squares due to regression SSE = sum of squares due to error
The Correlation Coefficient • Sample Correlation Coefficient where: b1 = the slope of the estimated regression equation
Model Assumptions • Assumptions About the Error Term • The error is a random variable with mean of zero. • The variance of , denoted by 2, is the same for all values of the independent variable. • The values of are independent. • The error is a normally distributed random variable.
Testing for Significance • To test for a significant regression relationship, we must conduct a hypothesis test to determine whether the value of b1 is zero. • Two tests are commonly used • t Test • F Test • Both tests require an estimate of s2, the variance of e in the regression model.
Testing for Significance • An Estimate of s2 The mean square error (MSE) provides the estimate of s2, and the notation s2 is also used. s2 = MSE = SSE/(n-2) where:
Testing for Significance • An Estimate of s • To estimate s we take the square root of s 2. • The resulting s is called the standard error of the estimate.
Testing for Significance: t Test • Hypotheses H0: 1 = 0 Ha: 1 = 0 • Test Statistic • Rejection Rule Reject H0 if t < -tor t > t where tis based on a t distribution with n - 2 degrees of freedom.
Testing for Significance: F Test • Hypotheses H0: 1 = 0 Ha: 1 = 0 • Test Statistic F = MSR/MSE • Rejection Rule Reject H0 if F > F where F is based on an F distribution with 1 d.f. in the numerator and n - 2 d.f. in the denominator.
Using the Estimated Regression Equationfor Estimation and Prediction • Confidence Interval Estimate of E(yp) • Prediction Interval Estimate of yp yp+t/2 sind where the confidence coefficient is 1 - and t/2 is based on a t distribution with n - 2 d.f.
^ Residual Analysis • Residual for Observation i yi – yi • Standardized Residual for Observation i where: ^ ^ ^