Download
1 / 25
310 likes | 629 Views
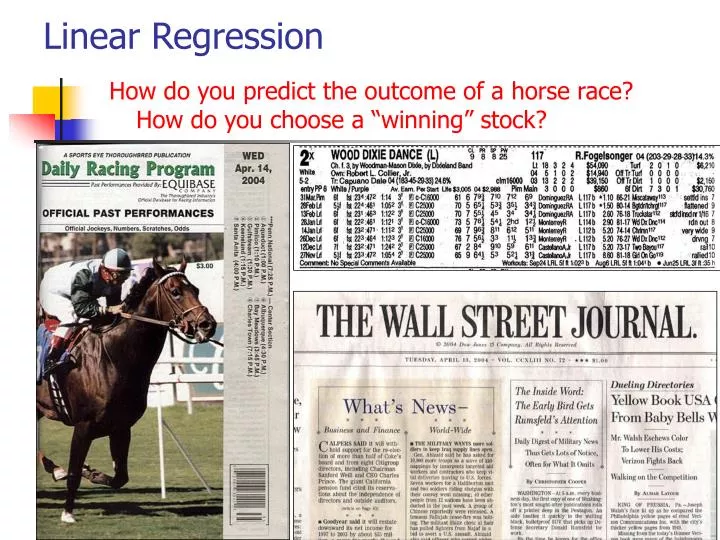
Linear Regression. How do you predict the outcome of a horse race? How do you choose a “winning” stock?. Linear Regression. Can we calculate values of one variable from another? e.g., race performance from lifetime race earnings? or, future salary from beginning salary?

E N D
Linear Regression How do you predict the outcome of a horse race? How do you choose a “winning” stock?
Linear Regression • Can we calculate values of one variable from another? e.g., race performance from lifetime race earnings? or, future salary from beginning salary? The equation that makes such predictions is that of a straight line: y = a +bx y: dependent variable (e.g. race performance), x=independent var. a: intercept, i.e., the predicted value for y when x=0 b: slope, i.e., how much y changes when x changes by 1 unit.
Choosing the Best Line • Minimize the average distance from the line to the points (the “least squares regression line”).
Calculating the regression line: Infant mortality predicted by number of hospital beds Predicted infant mortality = 86.111 – (0.829 x # of beds) 100 beds: 86.111 – 82.9 = 3.21 infant deaths per 1000 born 10 beds: 86.111 – 8.29 = 77.82 “ “ slope intercept
Linear Regression Applications • Show predhubble.dv • Show predbabbies.dv
Non-linear relationships • Some relationships are best explained by non-linear regression lines. (curvilinear regression)
Another example of a curvilinear relationship Temperature and comfort.
Exercise • Open file “salary.sav” . • Graph a scatterplot for the variables EDUCATIONAL LEVEL and CURRNET SALARY. • What is the Pearson’s correlation coefficient? • Does education predict salary? • In what direction?
Exercise: Predicting the winner • Open file “horses.sav” . • Graph scatterplots and compute correlations for all the variables. • Which variables are correlated? • Does the trainer’s winning percentage predict lifetime earnings for the horse? • Do lifetime earnings predict current performance? • In what direction?
Exercise: Predict the winning stock • Open file “stocks.sav” . • Graph scatterplots and compute correlations for all the variables. • Which variables are correlated? • Does the P/E ratio predict the stock performance? • Does Sales Growth predict the stock performance? • In which direction?
Accounting for Variance; Minimizing Error • Construct a regression model • Predict a set of raw scores • If the predictions are close to the true scores then the model is accounting for most of the variance in the true scores • The distance from the predicted score to the true score is the error in prediction • Square each difference and sum the squares • This is the Sum of Squares for Error (SSE)
Accounting for Variance; Minimizing Error Example: Hours Slept and Mood
Accounting for Variance; Minimizing Error Hours Slept and Mood
Accounting for Variance; Minimizing Error 1. Open file “mood.sav” 2. Compute Descriptives on Hours Slept & Mood 3. Compute bivariate correlation between Hours Slept and Mood 4. Calculate Actual-Predicted Mood and squared Actual-Predicted Mood using Compute. Sum of Squared values is SSE 5. Calculate linear regression for Actual Mood and Hours Slept Exercise: Hours Slept and Mood
Accounting for Variance; Minimizing Error 6. Create a variable called Meanmood using Compute in which all the values are the mean (4). 7. Calculate Actual Mood-Meanmood and squared Actual Mood-Meanmood using Compute in SPSS. 8. Sum the squared Actual Mood-Meanmood calculations by hand. This is total variance (Total Sum of Squares; TSS) Exercise: Hours Slept and Mood (cont.)
Accounting for Variance; Minimizing Error 9. Compute (TSS-SSE)/TSS (Variance accounted for in criterion, Error reduction) 10. Compare error reduction to the squared R. Exercise: Hours Slept and Mood (cont.)
Multiple Regression • What happens when you have more than one predictor? y = B(x) + C y = B1(x1)+B2(x2)+B3(x3) + C
Multiple Regression A practical application: How do I predict the outcome of a traumatic brain injury? What information available at the time of injury is correlated with outcome? Outcome: Post-injury IQ Injury related variables: Coma level, symptoms of severe injury (hematoma, pupil responses) Premorbid Status: Pre-injury IQ
Multiple Regression:Traumatic Brain Injury Coma Level: 0 = Unresponsive 1 = Responds only to pain 2 = Responds to pain and verbal command with nonspecific response 3 = Responds to pain or verbal command with meaningful response 4 = Somnolent (falls asleep) 5 = Awake and alert
Multiple Regression:Traumatic Brain Injury Prediction problem 1: Estimate Pre-injury IQ Predictors: Education Occupation School Grades Scores on Standardized Tests
Multiple Regression:Traumatic Brain Injury Prediction problem 1: Estimate Pre-injury IQ PMIQ = 3.5(Education) + 58
Multiple Regression:Traumatic Brain Injury Prediction problem 2: Estimate Post-injury IQ IQ = .4(PMIQ) + .4(Coma Level) + C Are these predictors redundant in their relationship to post-injury IQ?
Exercise: Predicting the winner • Open file “horses.sav” . • Graph scatterplots and compute correlations for all the variables. • Which variables are correlated? • Does the trainer’s winning percentage predict lifetime earnings for the horse? • Do Age or gender add predictive power? • Conduct three multiple regression analyses. Use total earnings as the dependent measure. • 1) Use trainer’s winning percentage as the predictor. • 2) Add Age as a predictor • 3) Add gender as a predictor