Download
1 / 31
310 likes | 318 Views
Science Skills. Scientific Method. An organized plan for gathering, organizing & communicating information Used for problem solving or to explain an observation. Figure 7. Figure 7. Figure 7. Figure 7. Figure 7. Figure 7. Where would Claim, Evidence and Reasoning fit in this sequence?.

E N D
Scientific Method • An organized plan for gathering, organizing & communicating information • Used for problem solving or to explain an observation
Figure 7 Where would Claim, Evidence and Reasoning fit in this sequence?
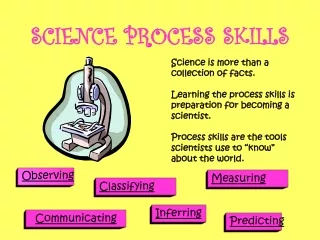
Scientific Method Vocabulary Observation – obtaining information through 5 senses (qualitative/quantitative) Hypothesis – a proposed answer to a question • If …. then . . . because . . . Variable – any factor in an experiment that can be changed
Controlled Experiment • An experiment in which one variable (IV) is deliberately changed, all other variables are kept constant Independent Variable (IV) – causes change in another variable (what I change) Dependent Variable (DV) – changes in response to IV (what you measure/your data) Control Group (C) – does not get manipulated Experimental Group(s) – gets manipulated Controlled Variables (CV) – all variables kept constant in an experiment
Time to practice Hypothesis worksheet IV/DV worksheet
SI – International System of Units • aka Metric system • Length – straight-line distance between two points (meter – m) • Mass – quantity of matter in an object (gram – g) • Volume – amount of space an object occupies (l x w x h = m3 (cubic meters)) • Density – ratio of mass : volume (kg/m3) • Temperature – measure of thermal energy Kelvin (K)—Celsius (C)
Figure 13 Common SI Measuring Units
Metric Mania Lets put your skills into practice….
Data Table Put the following information into a data table. Mrs. Walston wanted to figure out which type of dog had a faster average while running the mile – A pit-bull or a golden retriever. The pit-bull had the following time – 10min, 8.5 min, and 9 min. The Golden Retriever ran 9.5 min, 8.0 min, and 9 min.
Practice Let’s make sure you have it!
GRAPHING: Scientific Data and Analysis
GRAPHING: Line & Bar Graphs • Have an x-axis (horizontal) and a y-axis (vertical) • Each axis is a scale ranging from lowest number (data value) to highest
GRAPHING All Line and Bar Graphs Need: • Title that describes graph • Labeled and Numbered X and Y Axes
GRAPHING Bar Graphs Comparemeasurements, amounts, changes
GRAPHING: Group Bar Graph • Also compares groups of data • NEEDS A KEY
GRAPHING Line Graphs • Show a relationship between TWO factors– excellent for showing changes, trends, patterns over time/depth. • Allow you to graph more than one set of data on a single graph MOST IMPORTANT: allow you to answer “IF/THEN” questions
Figure 21: Mass vs. Volume of Water– DIRECTLY PROPORTIONAL, as one value increase, the other value increases. The slope tells the relationship between the variables.
Figure 21: Distance vs. Light Intensity– INVERSELY PROPORTIONAL, as the x-value increase, the y-value decreases.
GRAPHING: Multiple Line Graph • Compares different sets of data • NEEDS A KEY
GRAPHING WHAT IS WRONG WITH THESE GRAPHS?!
NO TITLE!!!!!!! What makes a great title?
Works Cited • Physical Science Concepts In Action • bell.sandi.net • solfire.com • www.mm.ocps.net • www.members.aol.com • www.blankner.ocps.net • www.abcteacher.com • partyfranke.de • www.studyzone.org • www.myleague.com • www.aep.com • www.grandearmee.com