Download
1 / 18
180 likes | 335 Views
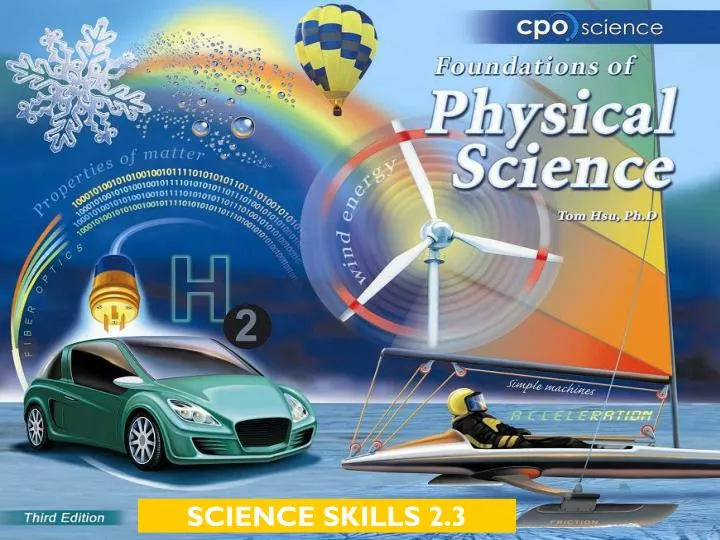
SCIENCE SKILLS 2.3. Chapter Two: Science Skills. 2.1 Mass and Volume 2.2 Density 2.3 Graphing 2.4 Solving Problems. Section 2.3 Learning Goals. Use graphs to create a visual representation of data. Analyze trends on a graph.

E N D
Chapter Two: Science Skills • 2.1 Mass and Volume • 2.2 Density • 2.3 Graphing • 2.4 Solving Problems
Section 2.3 Learning Goals • Use graphs to create a visual representation of data. • Analyze trends on a graph. • Explain the difference between a direct relationship and an inverse relationship.
Key Question: What is the thickness of aluminum foil? Investigation 2C Thickness of Aluminum Foil
2.3 Graphing • A graph is a visual way to organize data. • A scatterplot or XY graphis used to see if two variables are related.
2.3 Graphing • A bar graphcompares data grouped by a name or category.
2.3 Graphing • A pie graph shows the amount each part makes of up of the whole (100%).
2.3 Graphing • A “connect-the-dots” line graph is often used to show trends in data over time.
2.3 How to make an XY graph • Scatterplotsshow how a change in one variable influences another variable. • The independent variable is the variable you believe might influence another variable. • The dependent variable is the variable that you hope will change as a result of the experiment.
2.3 How to make an XY graph • Pressure is critical to safe diving. • How does an increase in depth affect the pressure? • What sort of graph would best show the relationship between pressure and depth?
2.3 How to make an XY graph • Choose x and y-axis • Depth is the independent variable = x axis • Pressure is the dependent variable = y axis • Make a scale • Most graphs use ones, twos, fives or tens • OR calculate the value per box • Plot your data • Create a title * Exception- when time is a variable
2.3 Identifying graph relationships • In a direct relationship, when one variable increases, so does the other. The speed and distance variables show a direct relationship.
2.3 Identifying graph relationships • When there is no relationship the graph looks like a collection of dots. No pattern appears.
2.3 Identifying graph relationships • In an inverse relationship, when one variable increases, the other decreases.
2.3 Reading a graph What is the speed of the car at 50 cm? • Find the known value on the x axis • Position = 50 cm • Draw a line vertically upward from 50 cm until it hits the curve. • Draw a line across horizontally to the y-axis from the same place on the curve. • Read the speed using the y axis scale. • Speed = 76 cm/s