Download
1 / 1
10 likes | 135 Views
When Measurement Models and Factor Models Conflict: Maximizing Internal Consistency.

E N D
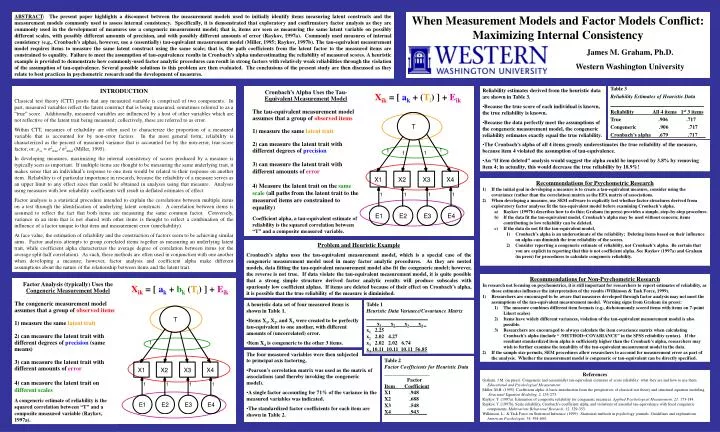
When Measurement Models and Factor Models Conflict: Maximizing Internal Consistency ABSTRACT: The present paper highlights a disconnect between the measurement models used to initially identify items measuring latent constructs and the measurement models commonly used to assess internal consistency. Specifically, it is demonstrated that exploratory and confirmatory factor analysis as they are commonly used in the development of measures use a congeneric measurement model; that is, items are seen as measuring the same latent variable on possibly different scales, with possibly different amounts of precision, and with possibly different amounts of error (Raykov, 1997a). Commonly used measures of internal consistency (e.g., Cronbach’s alpha), however, use a (essentially) tau-equivalent measurement model (Miller, 1995; Raykov, 1997b). The tau-equivalent measurement model requires items to measure the same latent construct using the same scale; that is, the path coefficients from the latent factor to the measured items are constrained to equality. Failure to meet the assumption of tau-equivalence results in Cronbach’s alpha underestimating the reliability of measured scores. A heuristic example is provided to demonstrate how commonly-used factor analytic procedures can result in strong factors with relatively weak reliabilities through the violation of the assumption of tau-equivalence. Several possible solutions to this problem are then evaluated. The conclusions of the present study are then discussed as they relate to best practices in psychometric research and the development of measures. James M. Graham, Ph.D. Western Washington University INTRODUCTION Classical test theory (CTT) posits that any measured variable is comprised of two components. In part, measured variables reflect the latent construct that is being measured, sometimes referred to as a “true” score. Additionally, measured variables are influenced by a host of other variables which are not reflective of the latent trait being measured; collectively, these are referred to as error. Within CTT, measures of reliability are often used to characterize the proportion of a measured variable that is accounted for by non-error factors. In the most general form, reliability is characterized as the percent of measured variance that is accounted for by the non-error, true-score factor, or: ρxx = σ2true / σ2total (Miller, 1995). In developing measures, maximizing the internal consistency of scores produced by a measure is typically seen as important. If multiple items are thought to be measuring the same underlying trait, it makes sense that an individual’s response to one item would be related to their response on another item. Reliability is of particular importance in research, because the reliability of a measure serves as an upper limit to any effect sizes that could be obtained in analyses using that measure. Analyses using measures with low reliability coefficients will result in deflated estimates of effect. Factor analysis is a statistical procedure intended to explain the correlations between multiple items on a test through the identification of underlying latent constructs. A correlation between items is assumed to reflect the fact that both items are measuring the same common factor. Conversely, variance in an item that is not shared with other items is thought to reflect a combination of the influence of a factor unique to that item and measurement error (unreliability). At face value, the estimation of reliability and the construction of factors seem to be achieving similar aims. Factor analysis attempts to group correlated items together as measuring an underlying latent trait, while coefficient alpha characterizes the average degree of correlation between items (or the average split-half correlation). As such, these methods are often used in conjunction with one another when developing a measure; however, factor analysis and coefficient alpha make different assumptions about the nature of the relationship between items and the latent trait. • Reliability estimates derived from the heuristic data are shown in Table 3. • Because the true score of each individual is known, the true reliability is known. • Because the data perfectly meet the assumptions of the congeneric measurement model, the congeneric reliability estimates exactly equal the true reliability. Table 3 Reliability Estimates of Heuristic Data ___________________________________ Reliability All 4 items 1st 3 items True .906 .717 Congeneric .906 .717 Cronbach’s alpha .679 .717___ Cronbach’s Alpha Uses the Tau-Equivalent Measurement Model The tau-equivalent measurement model assumes that a group of observed items 1) measure the same latent trait 2) can measure the latent trait with different degrees of precision 3) can measure the latent trait with different amounts of error 4) Measure the latent trait on the same scale (all paths from the latent trait to the measured items are constrained to equality) Xik = [ ak + (Ti) ] + Eik • The Cronbach’s alpha of all 4 items grossly underestimates the true reliability of the measure, because item 4 violated the assumption of tau-equivalence. • An “if item deleted” analysis would suggest the alpha could be improved by 3.8% by removing item 4; in actuality, this would decrease the true reliability by 18.9%! • Recommendations for Psychometric Research • If the initial goal in developing a measure is to create a tau-equivalent measure, consider using the covariance (rather than the correlation) matrix as the EFA matrix of associations. • When developing a measure, use SEM software to explicitly test whether factor structures derived from exploratory factor analyses fit the tau-equivalent model before examining Cronbach’s alpha. • Raykov (1997b) describes how to do this; Graham (in press) provides a simple, step-by-step procedure. • If the data fit the tau-equivalent model, Cronbach’s alpha may be used without concern; items contributing to low reliability can be deleted. • If the data do not fit the tau-equivalent model, • Cronbach’s alpha is an underestimate of the reliability; Deleting items based on their influence on alpha can diminish the true reliability of the scores. • Consider reporting a congeneric estimate of reliability, not Cronbach’s alpha. Be certain that you are explicit in reporting that this is not coefficient alpha. See Raykov (1997a) and Graham (in press) for procedures to calculate congeneric reliability. Coefficient alpha, a tau-equivalent estimate of reliability is the squared correlation between “T” and a composite measured variable. Problem and Heuristic Example Cronbach’s alpha uses the tau-equivalent measurement model, which is a special case of the congeneric measurement model used in many factor analytic procedures. As they are nested models, data fitting the tau-equivalent measurement model also fit the congeneric model; however, the reverse is not true. If data violate the tau-equivalent measurement model, it is quite possible that a strong simple structure derived factor analytic results will produce subscales with spuriously low coefficient alphas. If items are deleted because of their effect on Cronbach’s alpha, it is possible that the true reliability of the measure is diminished. • Recommendations for Non-Psychometric Research • In research not focusing on psychometrics, it is still important for researchers to report estimates of reliability, as those estimates influence the interpretation of the results (Wilkinson & Task Force, 1999). • Researchers are encouraged to be aware that measures developed through factor analysis may not meet the assumptions of the tau-equivalent measurement model. Warning signs from Graham (in press): • The measure combines different item formats (e.g., dichotomously scored items with items on 7-point Likert scales) • Items have widely different variances, violation of the tau-equivalent measurement model is also possible. • Researchers are encouraged to always calculate the item covariance matrix when calculating Cronbach’s alpha (include “ /METHOD=COVARIANCE” in the SPSS reliability syntax). If the resultant standardized item alpha is sufficiently higher than the Cronbach’s alpha, researchers may wish to further examine the tenability of the tau-equivalent measurement model in the data. • If the sample size permits, SEM procedures allow researchers to account for measurement error as part of the analysis. Whether the measurement model is congeneric or tau-equivalent can be directly specified. Factor Analysis (typically) Uses the Congeneric Measurement Model The congeneric measurement model assumes that a group of observed items 1) measure the same latent trait 2) can measure the latent trait with different degrees of precision (same means) 3) can measure the latent trait with different amounts of error 4) can measure the latent trait on different scales Xik = [ ak + bk (Ti) ] + Eik • A heuristic data set of four measured items is shown in Table 1. • Items X1, X2, and X3 were created to be perfectly tau-equivalent to one another, with different amounts of (uncorrelated) error. • Item X4 is congeneric to the other 3 items. Table 1 Heuristic Data Variance/Covariance Matrix _______________________ x1 x2 x3 x4_ x1 2.25 x2 2.02 4.27 x3 2.02 2.02 6.74 x4 10.11 10.11 10.11 56.85 The four measured variables were then subjected • to principal axis factoring, • Pearson’s correlation matrix was used as the matrix of associations (and thereby invoking the congeneric model). • A single factor accounting for 71% of the variance in the measured variables was indicated. • The standardized factor coefficients for each item are shown in Table 2. Table 2 Factor Coefficients for Heuristic Data _________________ Factor Item Coefficient X1 .948 X2 .688 X3 .548 X4 .943___ References Graham, J.M. (in press). Congeneric and (essentially) tau-equivalent estimates of score reliability: what they are and how to use them. Educational and Psychological Measurement. Miller, M.B. (1995). Coefficient alpha: A basic introduction from the perspectives of classical test theory and structural equation modeling. Structural Equation Modeling, 2, 255-273. Raykov, T. (1997a). Estimation of composite reliability for congeneric measures. Applied Psychological Measurement, 21, 173-184. Raykov, T. (1997b). Scale reliability, Cronbach’s coefficient alpha, and violations of essential tau-equivalence with fixed congeneric components. Multivariate Behavioral Research, 32, 329-353. Wilkinson, L., & Task Force on Statistical Inference (1999). Statistical methods in psychology journals: Guidelines and explanations. American Psychologist, 54, 594-604. A congeneric estimate of reliability is the squared correlation between “T” and a composite measured variable (Raykov, 1997a).