Download
1 / 1
10 likes | 139 Views
ABSTRACT

E N D
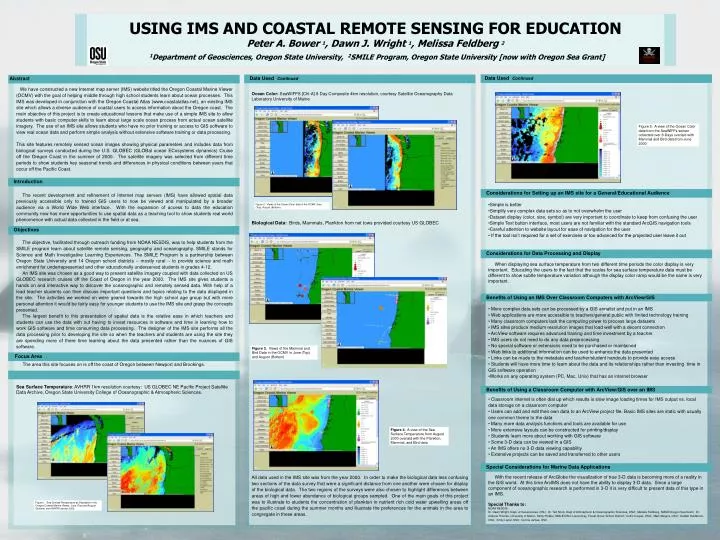
ABSTRACT We have constructed a new Internet map server (IMS) website titled the Oregon Coastal Marine Viewer (OCMV) with the goal of helping middle through high school students learn about ocean processes. This IMS was developed in conjunction with the Oregon Coastal Atlas (www.coastalatlas.net), an existing IMS site which allows a diverse audience of coastal users to access information about the Oregon coast. The main objective of this project is to create educational lessons that make use of a simple IMS site to allow students with basic computer skills to learn about large scale ocean process from actual ocean satellite imagery. The use of an IMS site allows students who have no prior training or access to GIS software to view real ocean data and perform simple analysis without extensive software training or data processing. This site features remotely sensed ocean images showing physical parameters and includes data from biological surveys conducted during the U.S. GLOBEC (GLOBal ocean ECosystems dynamics) Cruise off the Oregon Coast in the summer of 2000. The satellite imagery was selected from different time periods to show students key seasonal trends and differences in physical conditions between years that occur off the Pacific Coast. Introduction The recent development and refinement of Internet map servers (IMS) have allowed spatial data previously accessible only to trained GIS users to now be viewed and manipulated by a broader audience via a World Wide Web interface. With the expansion of access to data the education community now has more opportunities to use spatial data as a teaching tool to show students real world phenomenon with actual data collected in the field or at sea. Objective The objective, facilitated through outreach funding from NOAA NESDIS, was to help students from the SMILE program learn about satellite remote sensing, geography and oceanography. SMILE stands for Science and Math Investigative Learning Experiences. The SMILE Program is a partnership between Oregon State University and 14 Oregon school districts -- mostly rural -- to provide science and math enrichment for underrepresented and other educationally underserved students in grades 4-12. An IMS site was chosen as a good way to present satellite imagery coupled with data collected on US GLOBEC research cruises off the Coast of Oregon in the year 2000. The IMS site gives students a hands on and interactive way to discover the oceanographic and remotely sensed data. With help of a lead teacher students can then discuss important questions and topics relating to the data displayed in the site. The activities we worked on were geared towards the high school age group but with more personal attention it would be fairly easy for younger students to use the IMS site and grasp the concepts presented. The largest benefit to this presentation of spatial data is the relative ease in which teachers and students can use the data with out having to invest resources in software and time in learning how to work GIS software and time consuming data processing. The designer of the IMS site performs all the data processing prior to developing the site so when the teachers and students are using the site they are spending more of there time learning about the data presented rather than the nuances of GIS software. Focus Area: The area this site focuses on is off the coast of Oregon between Newport and Brookings. Data Used: Sea Surface Temperature: AVHRR 1km resolution courtesy: US GLOBEC NE Pacific Project Satellite Data Archive, Oregon State University College of Oceanographic & Atmospheric Sciences. Data Used Continued Data Used Continued Abstract • Things to consider when setting up an IMS site for general/educational audience • Simple is better • Simplify very complex data sets so as to not overwhelm the user • Dataset display (color, size, symbol) are very important to coordinate to keep from confusing the user • Simple Text button interface, most users are not familiar with the standard ArcGIS navigation tools • Careful attention to website layout for ease of navigation for the user • If the tool isn’t required for a set of exercises or too advanced for the projected user leave it out • Consideration for Data Processing and Display • When displaying sea surface temperature from two different time periods the color display is very important. Educating the users to the fact that the scales for sea surface temperature data must be different to show subtle temperature variation although the display color ramp would be the same is very important. • Benefits of Using an IMS over Classroom Computers with ArcView/GIS • More complex data sets can be processed by a GIS annalist and put in an IMS • Web applications are more accessible to teachers/general public with limited technology training • Many classroom computers lack the computing power to process large datasets • IMS sites produce medium resolution images that load well with a decent connection • ArcView software requires advanced training and time investment by a teacher • IMS users do not need to do any data preprocessing • No special software or extensions need to be purchased or maintained • Web links to additional information can be used to enhance the data presented • Links can be made to the metadata and teacher/student handouts to provide easy access • Students will have more time to learn about the data and its relationships rather than investing time in GIS software operation • Works on any operating system (PC, Mac, Unix) that has an internet browser • Benefits of Using a Classroom Computer with ArcView/GIS over an IMS • Classroom internet is often dial up which results is slow image loading times for IMS output vs. local data storage on a classroom computer • Users can add and edit their own data to an ArcView project file, Basic IMS sites are static with usually one common theme to the data • Many more data analysis functions and tools are available for use • More extensive layouts can be constructed for printing/display • Students learn more about working with GIS software • Some 3-D data can be viewed in a GIS • An IMS offers no 3-D data viewing capability • Extensive projects can be saved and transferred to other users • Special Consideration for Marine Data Applications: • With the recent release of ArcGlobe the visualization of true 3-D data is becoming more of a reality in the GIS world. At this time ArcIMS does not have the ability to display 3-D data. Since a large component of oceanographic research is performed in 3-D it is very difficult to present data of this type in an IMS. • Special Thanks to: • NOAA NESDIS • Dr. Dawn Wright, Dept. of Geosciences, OSU; Dr. Ted Strub, Dept of Atmospheric & Oceanographic Sciences, OSU; Melissa Feldberg, SMILE/Oregon Sea Grant; Dr. Andrew Thomas, University of Maine; Molly Phillips, SMILE/OSU; Laura Gray, Forest Grove School District; Collin Cooper, OSU; Mark Meyers, OSU; Keldah Heldstrom, OSU; Emily Larkin,OSU; Corrine James, OSU Ocean Color: SeaWIFFS [Chl-A] 8 Day Composite 4km resolution, courtesy Satellite Oceanography Data Laboratory University of Maine Biological Data: Birds, Mammals, Plankton from net tows provided courtesy US GLOBEC All data used in the IMS site was from the year 2000. In order to make the biological data less confusing two sections of the data survey that were a significant distance from one another were chosen for display of the biological data. The two regions of the surveys were also chosen to highlight differences between areas of high and lower abundance of biological groups sampled. One of the main goals of this project was to illustrate to students the concentration of plankton in nutrient rich cold water upwelling areas off the pacific coast during the summer months and illustrate the preferences for the animals in the area to congregate in these areas. USING IMS AND COASTAL REMOTE SENSING FOR EDUCATIONPeter A. Bower 1, Dawn J. Wright 1, Melissa Feldberg 21Department of Geosciences, Oregon State University, 2SMILE Program, Oregon State University [now with Oregon Sea Grant] Figure 5. A view of the Ocean Color data from the SeaWIFFs sensor collected over 8-Days overlaid with Mammal and Bird data from June 2000 Introduction Considerations for Setting up an IMS site for a General/Educational Audience Figure 2. Views of the Ocean Color data in the OCMV June (Top), August (Bottom). Objectives Considerations for Data Processing and Display Benefits of Using an IMS Over Classroom Computers with ArcView/GIS Figure 3. Views of the Mammal and Bird Data in the OCMV in June (Top) and August (Bottom) Focus Area Benefits of Using a Classroom Computer with ArcView/GIS over an IMS Figure 4. A view of the Sea Surface Temperature from August 2000 overlaid with the Plankton, Mammal, and Bird data Special Considerations for Marine Data Applications Figure 1. Sea Surface Temperature as Displayed in the Oregon Coastal Marine Viewer, June (Top) and August (Bottom) from AVHRR sensor 2000.