Download
1 / 1
10 likes | 88 Views
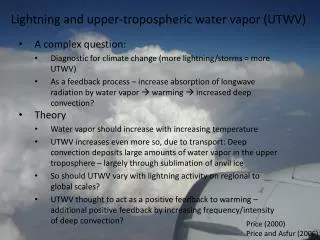
Ability of GEO-CAPE to Detect Lightning NOx and Resulting Upper Tropospheric Ozone Enhancement. Melanie Follette-Cook 1 , K. Pickering 2 , L.Wang 3 , M. Newchurch 3 , V. Natraj 4 , S. Kulawik 4 1 GESTAR/MSU 2 GSFC 3 U. of Alabama - Huntsville 4 JPL . melanie.cook@nasa.gov.

E N D
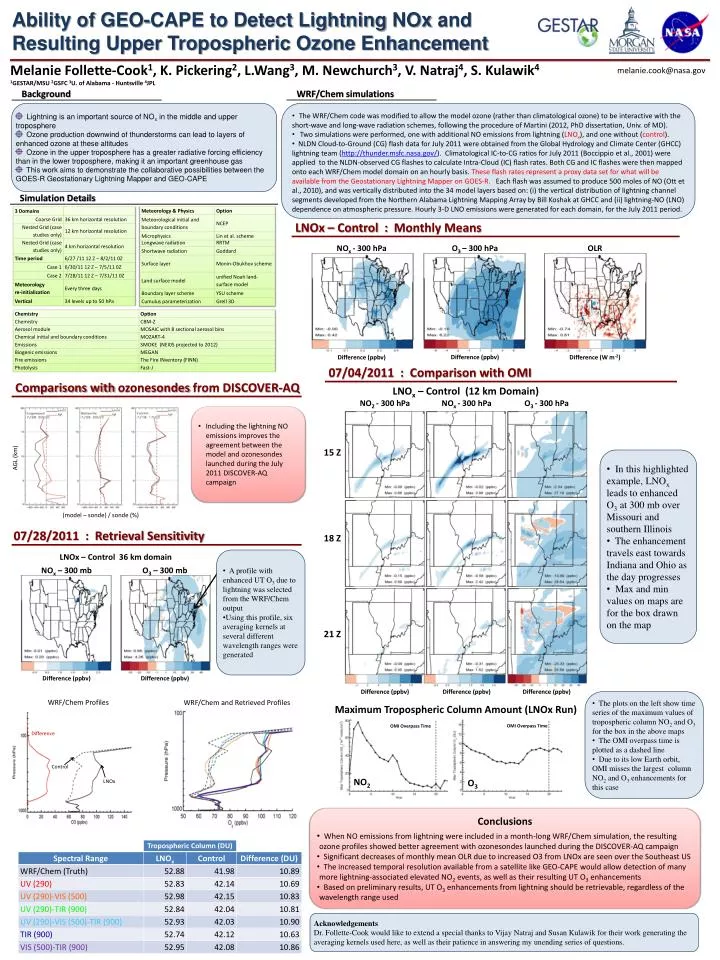
Ability of GEO-CAPE to Detect Lightning NOx and Resulting Upper Tropospheric Ozone Enhancement Melanie Follette-Cook1, K. Pickering2, L.Wang3, M. Newchurch3, V. Natraj4, S. Kulawik4 1GESTAR/MSU 2GSFC 3U. of Alabama - Huntsville 4JPL melanie.cook@nasa.gov WRF/Chem simulations Background Lightning is an important source of NOx in the middle and upper troposphere Ozone production downwind of thunderstorms can lead to layers of enhanced ozone at these altitudes Ozone in the upper troposphere has a greater radiative forcing efficiency than in the lower troposphere, making it an important greenhouse gas This work aims to demonstrate the collaborative possibilities between the GOES-R Geostationary Lightning Mapper and GEO-CAPE • The WRF/Chem code was modified to allow the model ozone (rather than climatological ozone) to be interactive with the short-wave and long-wave radiation schemes, following the procedure of Martini (2012, PhD dissertation, Univ. of MD). • Two simulations were performed, one with additional NO emissions from lightning (LNOx), and one without (control). • NLDN Cloud-to-Ground (CG) flash data for July 2011 were obtained from the Global Hydrology and Climate Center (GHCC) lightning team (http://thunder.msfc.nasa.gov/). Climatological IC-to-CG ratios for July 2011 (Boccippio et al., 2001) were applied to the NLDN-observed CG flashes to calculate Intra-Cloud (IC) flash rates. Both CG and IC flashes were then mapped onto each WRF/Chem model domain on an hourly basis. These flash rates represent a proxy data set for what will be available from the Geostationary Lightning Mapper on GOES-R. Each flash was assumed to produce 500 moles of NO (Ott et al., 2010), and was vertically distributed into the 34 model layers based on: (i) the vertical distribution of lightning channel segments developed from the Northern Alabama Lightning Mapping Array by Bill Koshak at GHCC and (ii) lightning-NO (LNO) dependence on atmospheric pressure. Hourly 3-D LNO emissions were generated for each domain, for the July 2011 period. Simulation Details NOx- 300 hPa OLR O3 – 300 hPa Difference (ppbv) Difference (ppbv) Difference (W m-2) LNOx – Control (12 km Domain) • Including the lightning NO emissions improves the agreement between the model and ozonesondes launched during the July 2011 DISCOVER-AQ campaign NO2- 300 hPa NOx- 300 hPa O3- 300 hPa • In this highlighted example, LNOxleads to enhanced O3 at 300 mb over Missouri and southern Illinois • The enhancement travels east towards Indiana and Ohio as the day progresses • Max and min values on maps are for the box drawn on the map AGL (km) 15 Z LNOx – Control : Monthly Means Comparisons with ozonesondes from DISCOVER-AQ 07/04/2011 : Comparison with OMI (model – sonde) / sonde (%) 07/28/2011 : Retrieval Sensitivity 18 Z WRF/Chem Profiles WRF/Chem and Retrieved Profiles • A profile with enhanced UT O3 due to lightning was selected from the WRF/Chem output • Using this profile, six averaging kernels at several different wavelength ranges were generated LNOx – Control 36 km domain NOx – 300 mb O3 – 300 mb Difference Control LNOx 21 Z Difference (ppbv) Difference (ppbv) • The plots on the left show time series of the maximum values of tropospheric column NO2 and O3 for the box in the above maps • The OMI overpass time is plotted as a dashed line • Due to its low Earth orbit, OMI misses the largest column NO2 and O3 enhancements for this case Maximum Tropospheric Column Amount (LNOx Run) Difference (ppbv) Difference (ppbv) Difference (ppbv) OMI Overpass Time OMI Overpass Time NO2 O3 • Conclusions • When NO emissions from lightning were included in a month-long WRF/Chem simulation, the resulting ozone profiles showed better agreement with ozonesondes launched during the DISCOVER-AQ campaign • Significant decreases of monthly mean OLR due to increased O3 from LNOx are seen over the Southeast US • The increased temporal resolution available from a satellite like GEO-CAPE would allow detection of many more lightning-associated elevated NO2 events, as well as their resulting UT O3 enhancements • Based on preliminary results, UT O3 enhancements from lightning should be retrievable, regardless of the wavelength range used Tropospheric Column (DU) Acknowledgements Dr. Follette-Cook would like to extend a special thanks to Vijay Natraj and Susan Kulawik for their work generating the averaging kernels used here, as well as their patience in answering my unending series of questions.