Download
1 / 15
150 likes | 153 Views
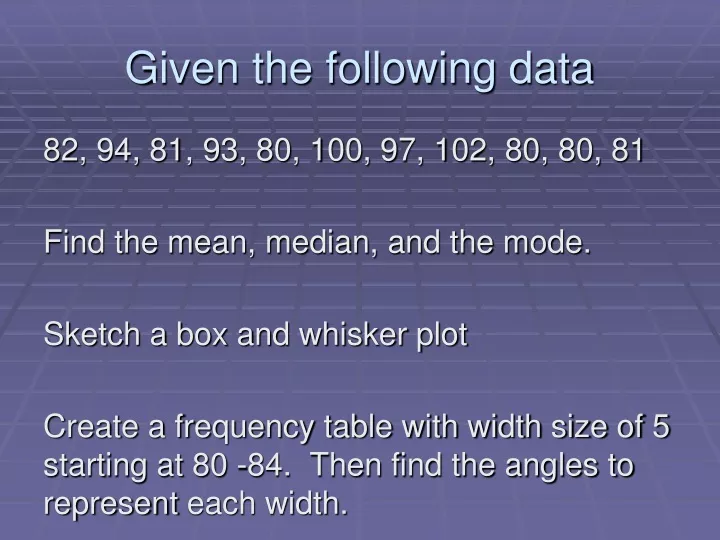
Given the following data. 82, 94, 81, 93, 80, 100, 97, 102, 80, 80, 81 Find the mean, median, and the mode. Sketch a box and whisker plot Create a frequency table with width size of 5 starting at 80 -84. Then find the angles to represent each width.

E N D
Given the following data 82, 94, 81, 93, 80, 100, 97, 102, 80, 80, 81 Find the mean, median, and the mode. Sketch a box and whisker plot Create a frequency table with width size of 5 starting at 80 -84. Then find the angles to represent each width.
Normal Distributions and the Empirical Rule OBJECTIVE: Use the empirical rule (68-95-97 rule) to analyze data Page 11
Data that is normally distributed ACT or SAT Scores Height IQ scores Biological measures
Normal Distribution Normal Distribution is a type of frequency distribution graph. The graph of a Normal Distribution is called a statistic distribution curve or more commonly referred to as a bell curve..
Properties of the Normal Distribution • Mean, median, & mode are the same • The data is symmetric aboutthe mean • Area under the curve equals1 or 100%. • Curve never goes below the x-axs • Standard deviation σ controls the spread of the curve.
Limits to the mean and standard deviation • The mean ranges between 1 and infinity • The standard deviation must be positive
The Empirical rule (68-95-99.7 rule) In the normal dist. with mean μ and standard deviation σ. • 50% of the observations fall below the mean. • 50% of the observations fall above the mean.
The Empirical rule (68-95-99.7 rule) In the normal dist. with mean μ and standard deviation σ. • 68% of the observations fall within of the mean. • 95% of the observations fall within of the mean. • 99.7% of the observations fall within of the mean. 1σ 2σ 3σ
Behold the normal curve 68% 34% 34% 0.15% 95% 0.15% 13.5% 13.5% 2.35% 2.35% 99.7%
Classwork & Homework Classwork – get with your project partner and decide on a topic for your project and a time to complete the survey. Homework – page 13 in your packet