Download
1 / 5
50 likes | 135 Views
Supplemental Figure 1. osterix. opn. bsp. osteocalcin. ***. 60. 35. 200. 1200. ***. ***. ***. 30. 50. 1000. 160. 25. 40. 800. 120. 20. Fold change. 600. 30. 15. 80. 400. 20. 10. 40. 200. 10. 5. 0. 0. 0. 0. central. endosteal. central. endosteal. central.

E N D
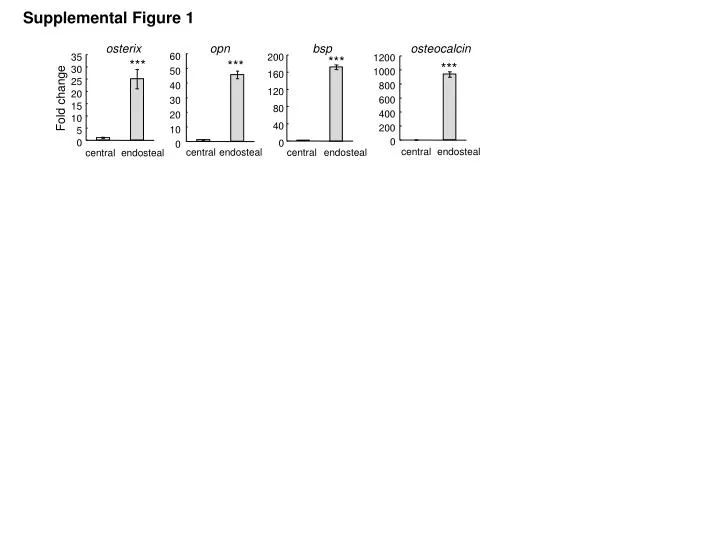
Supplemental Figure 1 osterix opn bsp osteocalcin *** 60 35 200 1200 *** *** *** 30 50 1000 160 25 40 800 120 20 Fold change 600 30 15 80 400 20 10 40 200 10 5 0 0 0 0 central endosteal central endosteal central endosteal central endosteal
Supplemental Figure 2 B C A ** central endosteal 0.7 200 0.6 150 0.5 0.4 CFU-F ALP+ (%) 100 CFU-F/106 cells 0.3 0.2 50 0.1 0 0 central endosteal central endosteal
Supplemental Figure 3 A i ii B i ii C i ii
Supplemental Figure 4 A Sca-1 CD105 CD29 CD71 CD166 CD73 CD44 CD34 CD45 99.8% 25.1% 81.9% 91.7% 42.1% 0.9% 59.4% 95.8% 46.5% central 99.8% 12.4% 70.5% 5.51% 93.1% 100.0% 57.4% 97.0% 96.7% endosteal B C growth growth OB AD central central endosteal endosteal
Supplemental Figure 5 A B C veh PTH ALP- ALP+ ** 140 ** 220 ALP- 120 200 100 160 80 CFU-F/106 cells CFU-F/106 cells 120 60 80 40 ALP+ 40 20 0 0 veh PTH veh PTH E D OB AD growth growth ALP- ALP+ veh PTH veh PTH * 2.5 * central 2.0 CFU-F diameter (mm) 1.5 1.0 endosteal 0.5 0 veh PTH