Download

1 / 7
70 likes | 72 Views
A chi-squared test is an assessment of how much a random process has deviated from its expected behavior. It gives us an output between zero and one where zero is a significant deviation and one is no deviation whatsoever.<br>Read more here >> https://www.thelotterylab.com/chi-squared-test

E N D
The Lottery Lab The Lottery Lab provides more than just today’s winning numbers. We give you access to massive data archives from popular games like Powerball and MegaMillions as well as local games.
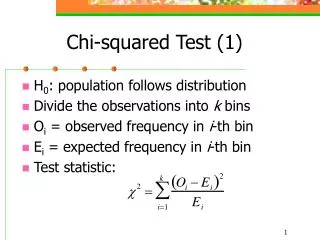
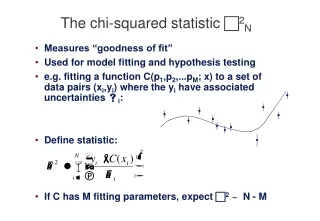
What Is A Chi Squared Test A chi squared test is an assessment of how much a random process has deviated from its expected behavior. It gives us an output between zero and one where zero is significant deviation and one is no deviation whatsoever. In our discussion of frequency analysis, we showed how statisticians, process engineers, and oddsmakers use frequency analysis and control charts to detect anomalies in random processes. While those techniques are simple to understand and easy to interpret, it can be difficult to determine if the deviation that we observe is meaningful or not.
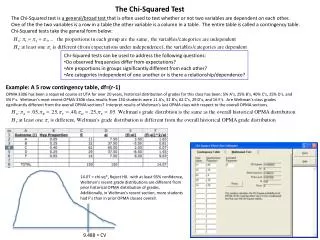
How Chi Squared Test Works As TheLotteryLab.com for Missouri’s Pick4. Although there is a total of four machines in this lottery, we are focused on the first two. Recall that since the Pick4 is a “numbers game” or “digit game”, each machine has ten balls numbered from 0-9 and only one ball is selected in each drawing. Both charts have at least one ball landing clearly in the red zone. For Machine 1 we have balls 4 and 8. For Machine 2 we have ball 5. Recall that 95% of all observations are expected to land within the yellow lines, so it is unusual that we would have so many balls in the red zone. an example, consider the frequency analysis charts from The question is: Could we get a single number to indicate whether these machines are behaving as expected? The answer is yes and the tool we use is the chi squared test. For the purposes of this discussion, we will skip the mathematics behind the test and focus on the principle of the test instead. If you are interested in more detail, see .
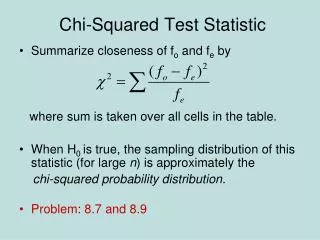
A chi squared test measures the distance between each observed frequency and the expected probability. For example, ball 2 has deviated very slightly from the expected probability while ball 5 has deviated a great deal. The test penalizes large deviations by squaring the distance between the observed frequency and the expected probability. Thus, ball 5 would indicate significantly more deviation than ball 2. These deviations are then added up and compared to standard tables. Once we compare the total squared deviation to these standard tables, we get a number between zero and one which can be used to assess the deviation of the machine. Low chi squared scores indicate that the machine has deviated from expected behavior. High scores indicate that the machine is conforming very closely to expected behavior. In reality, we are interested in both very low and very high scores. A score from 0-0.05 indicates that the machine has deviated too far from the expected behavior to be called “fair”. A score from 0.95-1 indicates that the
machine is so close to perfect that something might be forcing the observations to follow the expected behavior. For the two machines above, the chi squared test results are shown below. It is easy to see that Machine 1 has a very low score while Machine 2 has a score which is not particularly remarkable. Now that we understand how the chi squared test works and how it relates to frequency analysis, you might wonder how best to use it for your analysis. The chi squared test should serve as a screening criterion for frequency analysis and transition analysis. Before digging into all the details of a frequency control chart or a transition matrix, look at the chi squared test. If the score is between 0.1 and 0.9, there is not much value in trying to take advantage of hot or cold picks. If the score is low, then examine the frequency control chart to see what is causing the unusual behavior. If the score is high, look to the transition matrix to see if there is a pattern causing the behavior.
Contact Us 2812 Noble Fir Court Woodbridge, VA 22192 (Pincode) , USA Contact Us:- 814-207-2808 Website: https://www.thelotterylab.com/ Blog: https://blog.thelotterylab.com/