Download
1 / 7
70 likes | 202 Views
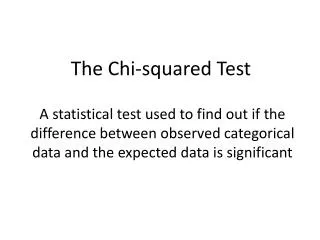
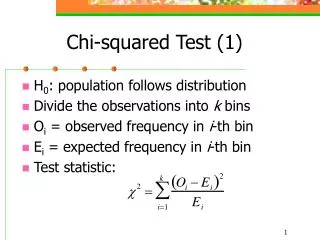
Ch. 10 Chi Squared Tests. Goodness of Fit. What Does a Goodness of Fit Test test?. Like the example with M&M’s, we are testing to see if our sample “fits” a given distribution.

E N D
Ch. 10 Chi Squared Tests Goodness of Fit
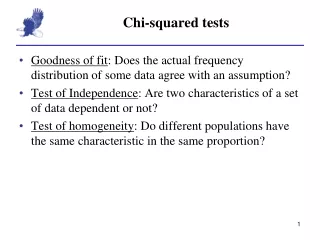
What Does a Goodness of Fit Test test? Like the example with M&M’s, we are testing to see if our sample “fits” a given distribution. Examples: Testing to see if the proportion of different ethnicities at Village is the same or different from all of the Los Angeles area.
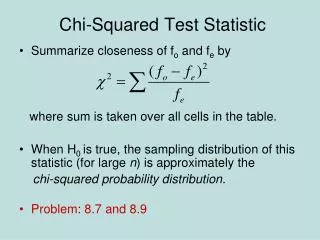
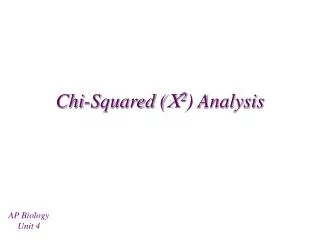
Ex 1: A certain plant has one dominant and one recessive gene for color. With those combinations, biologists predict that these plants are typically 25% Green, 50% Yellow-Green, and 25% Albino. You take a sample of 84 plants and observe the following: Perform a significance test to see if the these data differ significantly from what biologists have predicted.
Ex 1: A certain plant has one dominant and one recessive gene for color. With those combinations, biologists predict that these plants are typically 25% Green, 50% Yellow-Green, and 25% Albino.
Ex 1: A certain plant has one dominant and one recessive gene for color. With those combinations, biologists predict that these plants are typically 25% Green, 50% Yellow-Green, and 25% Albino.
Ex 1: A certain plant has one dominant and one recessive gene for color. With those combinations, biologists predict that these plants are typically 25% Green, 50% Yellow-Green, and 25% Albino. Step 3: Find the p-value and degrees of freedom
Ex 1: A certain plant has one dominant and one recessive gene for color. With those combinations, biologists predict that these plants are typically 25% Green, 50% Yellow-Green, and 25% Albino. Step 4: Conclusions (use α=.05)