Download
1 / 7
90 likes | 287 Views
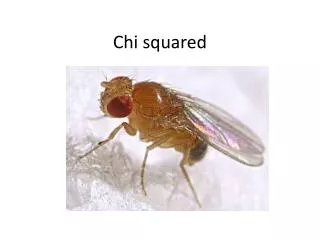
The Chi-squared Test. A statistical test used to find out if the difference between observed categorical data and the expected data is significant. In peas the gene for seed colour (G = green g = yellow) and the gene for seed texture (R = round r = wrinkled)

E N D
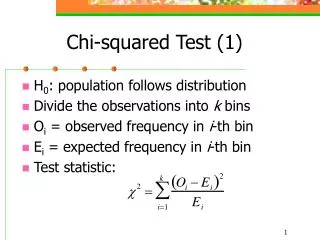
The Chi-squared Test A statistical test used to find out if the difference between observed categorical data and the expected data is significant
In peas the gene for seed colour (G = green g = yellow) and the gene for seed texture (R = round r = wrinkled) • 100 seeds are produced from two heterozygous • Individuals. The seeds are planted and grown, and • the following ratios of phenotypes are seen. • Are the genes linked or unlinked?
Are these numbers different from the numbers you predicted? • Are these numbers significantly different from the numbers you predicted?
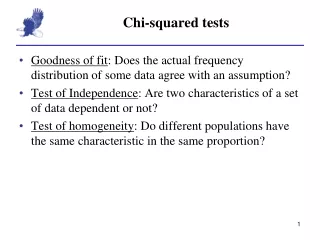
The Chi-squared test is used to test whether the difference between the observed and the expected data is significant. (If it is not significant it can just have occurred by chance) χ 2= ∑ (Observed – Expected)2 Expected Null hypothesis – There is no significant difference between the observed and the expected data
χ2= ∑ (Observed – Expected)2 Expected (23-19) 2 (7-6) 2 (21-19) 2 (49-56) 2 χ 2= + + + 19 6 19 56 χ 2= 0.875 + 0.21 + 0.84 + 0.17 χ 2= 2.09 Degrees of freedom = number of classes -1 So use the table on 135 to find out if you can reject or accept the null hypothesis.
In mice one of the genes for coat colour has the alleles F/f • F= yellow fur and is dominant to f= grey fur • When two heterozygous mice are crossed repeatedly they produce many litters of young. 140 pups are yellow and 68 grey • What is the genotype of the grey mice • What ratios of phenotypes would you expect in the offspring if this is a normal mendelian monohybrid cross? • Carry out a chi squared test to see if the difference between the observed and the expected data is significant • Suggest an explanation • To find out the genotype of an individual showing a dominant characteristic we do a test cross. The individual is crossed with one showing the recessive characteristic. If a heterozygous yellow mouse is crossed with a grey mouse what ratio of phenotypes would you expect in the progeny? ff 3:1
In cats the gene for coat colour has two alleles B = Brown b = Black The gene for fur length has two alleles, S – Short s - long Two heterozygous cats are crossed several times and 20 kittens are produced. Assuming that the genes are unlinked how many of each phenotype would you expect to see in 20 offspring? Phenotypes in the kittens Brown Fur, short fur - 13 Brown fur, Long fur- 2 Black fur, Short fur- 1 Black fur long fur- 4 Is this result significantly different from the expected result? Suggest a reason for this.