Download
1 / 44
440 likes | 548 Views
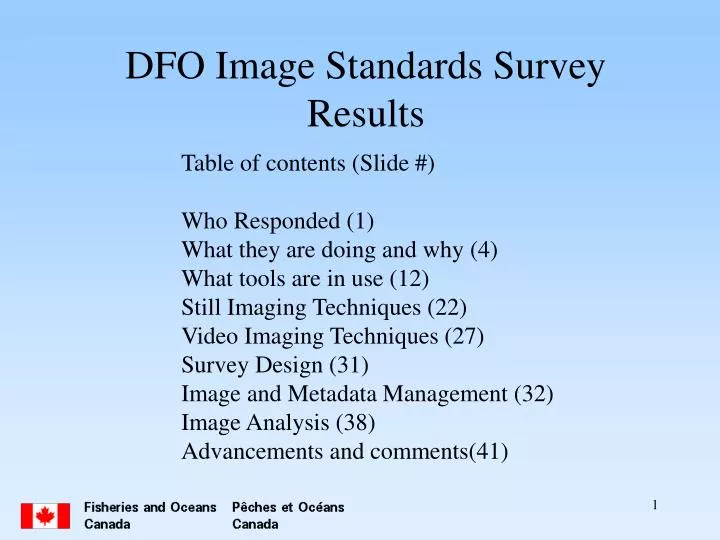
DFO Image Standards Survey Results. Table of contents (Slide #) Who Responded (1) What they are doing and why (4) What tools are in use (12) Still Imaging Techniques (22) Video Imaging Techniques (27) Survey Design (31) Image and Metadata Management (32) Image Analysis (38)

E N D
DFO Image Standards Survey Results Table of contents (Slide #) Who Responded (1) What they are doing and why (4) What tools are in use (12) Still Imaging Techniques (22) Video Imaging Techniques (27) Survey Design (31) Image and Metadata Management (32) Image Analysis (38) Advancements and comments(41)
What They are doing Human Perturbations impact of trawling, oil and gas industry changes in composition environmental impact of oil rig activities benthic community composition as enhanced areas are closed to fishing and following fishing impacts Biodiversity assess community dynamics Photodocumentation of benthic community composition Survey Stock assessment of potential community arctic fisheries composition stock assessment and species distribution estimate density based on habitat Calibrate other systems acoustic remote sensing tool to classify seabeds used for demersal capelin spawning Monitoring Monitor the impacts of finfish farm activities over hard bottoms
Primarily in Discovery Corridor • experimental units repeated sampling in time • Arctic • any patch of bottom of interest to clients • Northeast Newfoundland Discovery Corridor • Based on finfish farm activities: baseline information peak production
resulting recognition software is intended to accomodate all of the above • nearshore habitat mapping
Not done for groundtruthing • Not integrated with project yet • uses video for ground-truthing habitat characteristics no sensing technology used Groundtruth: sidecan, multibeam, Trawls, grabs, interpreted acoustic multibeam, QTC to determine habitat type, ROV images were used to ground-truth acoustic data.
any images at any depth; • we do not have any imaging hardware but will • soon be outfitting our MUN Explorer AUV with an imaging system • 0 - 300 metres
Environmental Health some focus on pelagics and benthic organisms inshore • Macrophytes • Rockfishes, Capelin, Rockfish, Urchin, sea cucumbers(Echinoderms), shrimp, crabs, anemones, sponges, corals, worms, lobster, scallop • algorithms accommodate any and all types as well as other items of interest • oil contaminants
What are the Tools used • For applications deeper than 30m I have used a variety of platforms including submersibles. • Don’t specify equipment design and evolution but I do evaluate system specs for • my applications and propose amendments • Also in previous years we have used the manned submersible • Aquarius in the same manner as the ROV • AUV imaging system not yet in place • Troika video system
Digital Nikon D1Xs have been used most recently • we have used many cameras • Use various systems on major platforms (ROPOS CAMPOD) • provided by others • color with low light switch to B&W
Depends on system provided by others. • Typically range from high-res color to low light black and white. • not aware of equipment specifications. • 480 horizontal lines resolution • Osprey 1359 monochrome 400 tv lines; OE14-113 450 tv lines
System dependent. • Have used high res close up on zoom color cameras on ROPOS • as well as swept-area color systems on towcam and quadrat view of campod • not aware of equipment specifications • we have used all the above camera types the area of the image depends on the • altitude and visability • On bottom 1/4 square meter view zoomed out. • Zoom lens 4.2mm to 44 mm F1.8 to F2.9. Rotation 360 deg continuous • and 180 deg tilt.
Have had to integrate various system-provided option into own • project work. Systems such as ROPOS have laser scaling. • Major requirement is background specs provided by system owner • to enable use of imagery in my programs • have used paired lasers as well as a three beam system • In previous incarnations of the system a single ball of known • dimensions was used to size images. • The newest as yet untested system uses lasers to normalise the • camera to the bottom and determine the distance from the • bottom for proper focus. • lasers 10cm apart to estimate size and distance • 10 cm fixed by Tritech • Have altitude and pitch/roll info for possible further refinement of areal estimates
NAUI recorded on audio track using audio modem • and decoded for real time post processing • Use in house ' CAROL/ClassEvent software
Screenshots if needed • System dependent
TrackPoint 2 • DGPS antenna set up directly above deployment block and scope kept to 0. • GLL string logged for temporal/positional data tracked with GIS and visually overlayed on • Video • high end dGPS with TrackLink transponder (towed camera) or vertical cable (drop camera) • for true camera position on video overlay • GPS trackpoint positioning to determine the start position of the underwater vehicle then • doppler velocity logger (DVL) and ring laser gyro (RLG) for positioning from this start point. • Rely principally on navigation provided by system providers eg ROPOS. • Main issue is integrating these capabilities into DFO regular navigation processing
System-depended. Need to obtain metadata from system providers • in order to properly incorporate data into main project databases • TrackLink uses dGPS digital compass and transceiver feeds all NMEA • NMEA data overlayed on video with Outland in decimal minutes • but logged with Class Event in decimal degrees • A knudsen echosounder is used to trigger the camera. • Depth/GPS is recorded through its recording capabilities.
Depends on system used. Typically look for a system which will provide multiple • views (wide and tele) or types (still/video) views of bottom to facilitate • interpretation of bottom features • have used analog and digital video and stills from digital video frame grabs • Video is used for aiming the still camera and to detect larger more disperse organism. • Resolution of video has not been sufficient for the objectives of the study. • Light sensitivity .02 lux. • currently working with still images video is feasible • Frame grabs used for size estimation
Still Imaging Techniques • Used to collect analog • Rarely take screenshots from video • As long as end result is digital
No we do not currently have a standard format for filenaming. • Images are currently archived with project-specific directories • videodive# transect# time
In development but at the moment using XP shared drive • database infrastructure and GIS accessability • access database on an SQL server • For video we use Oracle database • not applicable
Video Imaging Techniques • To date most systems I have used have been tape-based. • Have no objection to working with systems which use direct to hard drive but range of system recording media does make problems for end user working on a common theme across various tools • not aware of equipment specifications • DV tape based but have recorded directly to hard drives
Outland overlay of Ships Nav and GPS time • dive# transect# date time depth lat/long • Heading depth lat/long site name • time lat long • date time heading depth and text describing the dive area and number • GPS overlay • Horita video overlay lat / long is true camera position via transceiver internal date and time stamp • Sea-Trak GPS Video Screen Overlay used to overlay position date time on tape. • System dependent. We usually rely on the system provider to • give us the appropriate metadata for GPS and time overlays
Roxio Easy Media Creator • custom software use MS explorer • PowerDVD (free software provided by BIO) not a good image - just for presentations • Roxio version 9 • PinnacleUse software with Sony digicam. Image quality medium.
Survey Design • Stratified random design. Coast line is divided into 500m points that are randomly selected. Depth transects from 5 to 100m (varies with project) aligned perpendicular to the shore line are sampled with a still camera. 10 frames shot per station at preselected depth intervals • Area divided into 1 km grid squares. Grids squared randomly selected and video transects conducted across grid • towed video or drop camera to ground truth sidescan transects. • Towed video transects sometimes used alone. • ROV was deployed to record images based on prior knowledge from the acoustic data. • Rockfish survey areas are chosen based on habitat derived from remotely sensesd data (multibeam and backscatter) • We elect a stratum (polygon) covering the survey area and perform multiple random drift transects within. Transects may then be randomly subsampled by time depth or other criteria. • 200 m transects beginning at the edge of net pen in the dominant current direction generally around slack tide. • Stratified random design. Coast line is divided into 500m points that are randomly selected. Depth transects from 5 to 100m (varies with project) aligned perpendicular to the shore line are sampled with a still camera. 10 frames shot per station at preselected depth intervals. • Area divided into 1 km grid squares. Grids squared randomly selected and video transects conducted across grids. • towed video or drop camera to ground truth sidescan transects • Towed video transects sometimes used alone. • ROV was deployed to record images based on prior knowledge from the acoustic data. • Rockfish survey areas are chosen based on habitat derived from remotely sensesd data (multibeam and backscatter) • We elect a stratum (polygon) covering the survey area and perform multiple • random drift transects within. Transects may then be randomly subsampled by time depth or other criteria200 m transects beginning at the edge of net pen in the dominant current direction generally around slack tide.
Image and Metadata Management • With some systems provided by others master tapes are retained in an integrated system. For other project specific applications we are required to manage the tape library
Access database • not applicable • Database • We do not maintain a still image database only frame grabs for publications/talks
Fire safe locker at a different site than the analysis building • miniDV tape is original AVI clips created from that are the working copies. All AVI are embedded in ArcGIS projects. • video tapes to off site fire safe storage stills to hard drives and server
Access database fields include species and habitat description • the ArcGIS projects are the catalog • Images are stored on a network drive • Access database • Oracle database for all video • The database that manages the metadata has the tape name and relavent metadata. • The physcal asset is stored separately on a shelf • Videos are numbered and listed in operation book & on spreadsheet
With some of the systems we use for deep water research we can incorporate images into a searchable catalog. We actually don’t have anything comparable to our own URCHIN archive for diverse media • not applicable • ArcGis
Not sure • Not that we know of • We try and use FDGC and ITIS but are not fully compliant • not applicable
Image Analysis • DVLogger custom software • the development of a versatile automated image analysis system is my PhD thesis work • Video review watch all video and record observations of species and habitat changes. We use software developed by us to control the DV deck and record to a text file automatically. • I run them into Pinnacle studio program to play with the towed speed brightness etc
We create child images • Still Images are enhanced in photoshop and annotated as counted.
URCHIN Can Tech Rep Fish Aquat Sci 2553 2004 • Martin J.C. Lacko L.C. and Yamanaka K.L. 2006. A pilot study using a Remotely Operated Vehicle (ROV) to observe inshore rockfish (Sebastes spp.) in the southern Strait of Georgia March 3-11 2005
Advancements and comments • adequate hard drive space and backups more site licences for image analysis software • Readily accessible electronic archive that conducts backups • Currently we view video recordings on TV screen and manually record data on paper. We then enter data (lat/long species bottom type comments...)into excel spreadsheet. • We would like to see image analysis automated for the detection and entering of appropiate data (lat/long species)in spreadsheet. • Have a capital funding request in system already for a high definition camcorder system. Also have a request for capital funding for a USBL acoustic positioning system (tracklink) that can be used for positioning divers. This would allow much more flexibility in acquiring diver held video as real-time positioning would be collected. Images could subsequently be matched by time. • To develop software to control DV tapes and record species & habitat to a database with a standardized structure to make the analysis faster and cleaner. • We are leading the Image Archive Pilot project as part of the National Science Data Management Committee initiatives to .... • We plan to employ a tracking beacon on URCHIN version 2 in the future once the hardware is available...Tracklink
The Department of Fisheries and Oceans should continue to invest into underwater video/photographic technology and encourage its development. Video recording is an environmental friendly sampling method. Video surveys and advances in image analysis has become a valuable and effective research and communication tool when dealing with the industry. • I feel that for shallow water applications particularly in complex hard-bottom habitats (vertical rock walls boulder-fields etc) diver held video is much more cost effective and adaptable than ROV. ROV does have a capability for longer deployment times but for light-weight coastal ROV's they cannot replipicate the dexterity and positioning capability of diver-held still and video imagery. Also with divers image acquisition can easily be incorporated in to other in situ observation and measurement.
Comments Con’t. • Good Survey. We have been very proactive in data logging and use of relational databases and GIS for data retrieval and analysis. Our survey protocols are well documented and we comply to a very high standard in terms of data collection. • In the Shellfish section of MEAD in the Pacific we are in the infancy of video data management. Although we have a MS Access database to catalogue the metadata for the videos that we have the section as a whole has not adopted standard operating procedures for the storage and cataloguing of video imagery. • I'm new in this field and I wish to be gain knowledge about the different methods out there and how to get access to them.