Download
1 / 33
330 likes | 657 Views
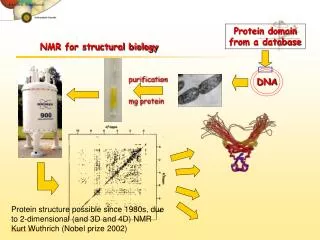
Structural Analysis using NMR. Naveena Sivaram Research Report # 5. Overview . NMR studies were performed in Peripherin peptides Epidermal Growth factor Receptor Transducer Results Conclusions & Outlook. Interaction GARP2/Peripherin. Peripherin/rds ( retinal degeneration slow ):

E N D
Structural Analysis using NMR Naveena Sivaram Research Report # 5
Overview • NMR studies were performed in • Peripherin peptides • Epidermal Growth factor Receptor • Transducer • Results • Conclusions & Outlook
Interaction GARP2/Peripherin • Peripherin/rds (retinal degeneration slow): • highly conserved in both rod and cone photoreceptors of all vertebrates • 4 TM glycoprotein (39 kDa) present in photoreceptor outer segment discs • forms homodimers in rods (covalently bonded), heterodimers with ROM-1 • are located at the disc rim and may play a role in anchoring the • disc to the cytoskeletal system of the outer segment Taken from Karin Presentation
P3 P1 P2 Cytosol Intradiscal space Taken from Karin Presentation Peripherin peptides
Peripherin peptides Measured TOCSY, COSY, ROESY/NOESY,15N & 13C HSQC COSY & 13C HSQC P1: ALLKVKFDQKKRVKLAQG aa position in Protein: 1-18 P2: KICYDALDPAKYAKWKPWLKPY aa position in Protein: 79-100 P3: RYLHTALEGMANPEDPECESEGWLLEKSVPETWKAFLESVKKLGKGNQVEAEGED AGQAPAAG aa position in Protein: 283-345 P3A: RYLHTALEGMANPEDPECESEGWLL aa position in Protein: 283-308 P3B: KSVPETWKAFLESVKKLGKGNQVEAEGEDAGQAPAAG aa position in Protein: 309-345 15N HSQC & 13C HSQC P Only TOCSY & ROESY
Peripherin peptides Measured TOCSY, COSY, ROESY/NOESY,15N & 13C HSQC P3AS: (mixed) RYLHTALEGMANPEDPECESEGWLL aa position in Protein: 283-308 P3BS: (mixed)KSVPETWKAFLESVKKLGKGNQVEAEGEDAGQAPAAG aa position in Protein: 309-345 TOCSY, ROESY & COSY P P1: ALLKVKFDQKKRVKLAQG aa position in Protein: 1-18 R2: VLTWLRKGVEKVVPQPA aa position in Protein: 100-116 15N HSQC • Missing Experiments : • P3AS : 15N and 13C – HSQC’s • P3B : COSY,15N and 13C – HSQC’s • P3A : Have to rerun everything
COSY ( cosydfesgpph ) • COrrelation SpectroscopY • Each pair of coupled spins shows up as a cross-peak in a 2D COSY spectrum. • The diagonal peaks correspond to the 1D spectrum. • Cross peaks are useful for assigning individual amino acid “spin systems” KICYDALDPAKYAKWKPWLKPY
TOCSY ( dipsi2esgpph ) • Total Correlation Spectroscopy • Relies on scalar or J couplings • J coupling between nuclei that are more than 3 bond lengths away is very weak • Number of protons that can be linked up in a 2D TOCSY spectrum is therefore limited to all those protons within an amino acid KICYDALDPAKYAKWKPWLKPY
ROESY/NOESY ( noesyesgpph ) • Nuclear Overhauser Enhancement Spectroscopy • Each cross peak in a NOESY spectrum indicates that the nuclei resonating at the 2 frequencies are within 5 Å in space. • Intensity of cross peaks is related to internuclear distance KICYDALDPAKYAKWKPWLKPY
HSQC • Heteronuclear Single-Quantum Coherence • spectrum contains the signals of the HN protons in the protein backbone • Each signal in a HSQC spectrum represents a proton that is bound to a nitrogen atom • use of these hetero nuclei facilitates the structure determination • 15N – HSQC (fhsqcf3gpph) and 13C – HSQC ( hsqcetgpsi2 )
KICYDALDPAKYAKWKPWLKPY ALLKVKFDQKKRVKLAQG HSQC Spectra Figure A: 1H,15N-HSQC Spectrum of Peptide P1 B: 1H,13C-HSQC Spectrum of Peptide P2
Per_P1 & Garp_R2 interaction Peptide P1 (1.5mM) Peptide P1 + R2 (0.7mM) G18
Contd… B. A. Figure A: P1 overlapped on P1R2 15N-HSQC Spectrum B: 15N-HSQC Spectrum of Peptide R2 (Karin)
Conclusions • Spectra obtained show well resolved resonances - teritiary structure • Chemical shifts of two residues in P1 have shown to shift by more than 0.05 ppm in 15N dimension
Future Work • Running the missing expt’s to get the complete data for all Peripherin Peptides • Analysing chemical shifts and determining the structure for the Peripherin Peptides • Trying out the different combinations of Peripherin and GARP Peptides
151 151 312 312 481 481 621 621 687 687 955 955 1186 1186 L1 L1 CR1 CR1 L2 L2 CR2 CR2 Kinase Kinase CT CT JM JM 644 644 Extracellular portion Extracellular portion Intracellular portion Intracellular portion Epidermal Growth Factor Receptor (EGFR)the transmembrane + juxtamembrane domains The transmembrane + juxtamembrane part (615-686 a.a. + N-terminal 7His-tag) contains the transmembrane and the regulatory juxtamembrane (JM) domain 615 – MHHHHHHH GPKIPSIATGMVGALLLLLVVALGIGFMRRRHIVRKRTLRRLLQERELVEPLTPSGEAPNQALLRILKETE-686 Resource from Ivan’s Presentation
Figure : EGFR-EGF complex view with the two-fold axis oriented vertically (taken from den Hartigh JC etal,J Cell Biol 1992). Domains I and III correspond to L1 and L2, domains II and IV - to CR1 and CR2, respectively.
Important information about the tj-EGFR • 73 amino acid residues (without tag) • carries N-terminal 7His-tag • molecular weight is about 9,112 Da • contains no Cys residues • contains no aromatic residues (Trp, Tyr or Phe) • NMR structure of the juxtamembrane domain is available Choowongkomonet al. (2005), J. Biol. Chem. Resource from Ivan’s Presentation
NMR Studies • 15N HSQC(fhsqcf3gpph) • OG • 1%SDS • 2.5%SDS • 5%SDS • 2D HET-NOE • 3D NOE Choowongkomon et al. (2005), J. Biol. Chem.
15N HSQC in OG G K Figure : 1H,15N-HSQC spectrum of the transmembrane+juxtamembrane fragment in 50 mM NaPi pH 6.0, 10% D2O, 5% octyl glucoside
15N HSQC in OG + 1% SDS G K Figure : 1H,15N-HSQC spectrum of the transmembrane+juxtamembrane fragment in 50 mM NaPi pH 6.0, 10% D2O, 1% sodium dodecyl sulfate
Comparison of OG & 1% SDS Histidines R ?
juxtamembrane domain NMR studies In H2O In Phosphocholine Choowongkomon et al. (2005), J. Biol. Chem.
Conclusions • 1H,15N HSQC studies in OG shows limited spectral dispersion suggesting little stable tertiary structure • 1H,15N-HSQC spectrum in OG has a qualitatively similar appearance as the one in phosphocholine • In the presence of SDS, the spectral dispersion significantly increased • Increasing in SDS concentrations after some point did not show significant effect • Quick analyses of chemical shifts suggested that some of the new peaks in HSQC are from H’s and R’s
Future Work • Analysing chemical shifts inorder to quantify the claim of increase in spectral dispersion induced by SDS compared to that of OG sample and to find ideal SDS concentration • Analyzing & Assigning of the resonance peaks in 1H,15N-HSQC spectrum of tj-hegfr sample in SDS, to find out if the new peaks in the spectrum are resulting from the +vely charged residues
Transducer in N.Pharaonis • Phototaxis system is a complex consisting of the Sensory rhodopsin II (SRII) and the transducer protein HtrII • Light-activation of SRII induces structural changes in HtrII • 2-helical membrane protein with a long cytoplasmic extension • structure of cytoplasmic fragment of HtrII (HtrII-cyt), playing an important role in information relay, remains unknown
NMR Studies • 1H-15N HSQC – fhsqcf3gpph • 1H-15N HSQC (Ammonium Sulphate) • 1H-15N HSQC (Ammonium Sulphate) • 20oC • 37oC • 8oC • 2oC
HtrII_15N HSQC Figure : 1H,15N-HSQC spectrum of the htrII fragment in 20 mM NaPi pH 6.0, 10% D2O
HtrII_15N HSQC(Ammonium Sulphate) Figure : 1H,15N-HSQC spectrum of the htrII fragment in 20 mM NaPi pH 6.0, 10% D2O & 5% Ammonium Sulfate.
Conclusions • Observed that the signals intensities were varying under different buffer conditions • The high peak intensities suggests that their be a localized structure • 1H,15N-HSQC spectrum performed at different temparatures suggest that the transducer may not be in an aggregated state
Future Work • Analysis and investigation of AA involved in changes and their occurrence in the crystal structure • Changes in spectrum and chemical shifts at different temperatures
Acknowledgements • Judith Klein-Seetharaman • Karin Abarca Heidemann • Ivan Budyak • David Man