Download
1 / 27
280 likes | 427 Views
Week 7 Environmental and Policy Factors and Obesity Dr. Bonnie Beezhold Assistant Professor, Nutrition Benedictine University. Eating behaviors are complex.

E N D
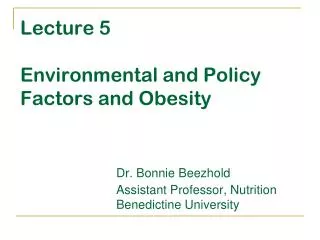
Week 7Environmental and Policy Factors and ObesityDr. Bonnie Beezhold Assistant Professor, Nutrition Benedictine University
Eating behaviors are complex There is a complex interplay of physiological, psychological, social, and genetic factors that influence meal timing, quantity of food intake, food preference, and food selection But does our ENVIRONMENT play a special role?
Food system changes • Increased supply of cheap, palatable, energy-dense foods • Improved distribution systems for convenience and accessibility of these foods • More persuasive and pervasive food marketing Swinburn et al, 2011
For more information on agricultural policy and obesity, go to: http://aphg.jhsph.edu/index.cfm?event=browse.subject&subjectID=31
Industrialized agriculture and obesity • http://www.jhsph.edu/research/centers-and-institutes/johns-hopkins-center-for-a-livable-future/ • The status quo > continued drive to fewer farms in the hands of small number of companies, subsidies for commodity crops (corn and soy), factory farms, cheap prices, and more processed foods • Farm bill (last revised 2007)
http://www.huffingtonpost.com/2011/11/09/map-every-mcdonalds-us_n_1084045.htmlhttp://www.huffingtonpost.com/2011/11/09/map-every-mcdonalds-us_n_1084045.html
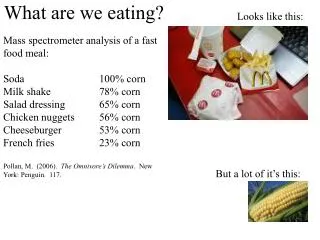
Sweetened beverage intake and the prevalence of obesity have risen over the same time period Between 1977 and 2002, Americans on average increased their energy intake from soft drinks by 228 % and their energy intake from fruit drinks by 171 %. Soft drinks contribute more energy to the diet than any other single type of food or beverage; they are also the top source of liquid energy in the US. Woodward-Lopez, Kao, Ritchie, 2011
Evidence of link between sweetened beverage intake and obesity • The majority of observational studies (higher quality) show that sweetened beverage intake is significantly associated with greater adiposity • Only one study reported a negative association • 2 RCTs showed that successful reduction of sweetened beverage intake reduced adiposity among children • 4/6 trials showed weight gain among free-living adults who increased intake of sweetened beverages • 2 trials failed to detect a significant impact on adiposity (lower quality design) Reid et al, 2007
Childhood obesity and fat cell theory • Fat cell numbers may increase more quickly in children, leading to life-long tendency toward obesity (hyperplastic)
Consumption factors • Of 21 food and beverages investigated, red meat and fruit were negative associated with a difference in waist circumference • Snack foods were positively associated with the difference in WC Halkjær et al, 2009
Other eating trends related to obesity • Not enough fruits and vegetables (per guidelines) • Population fat intakes exceed recommendations by at least 10% • The sharp increase in portion size over the last few decades has distorted our perceptions • Increase in plate (10" to 12"), bowl, cup sizes, utensils Wang & Beydoun, 2011
The relative cumulative mean (±SEM) effect size on food intake for alcohol consumption, sleep deprivation, and television watching. Studies curtailing these factors have shown a decrease in food intake. Chapman C D et al. Am J Clin Nutr 2012;96:492-497
Socioeconomic factors • Low SES and minority groups are disproportionately affected at all ages • Diets of low SES households provide cheap, concentrated energy from fat, sugar, cereals, potatoes, fatty meats; they eat negligible whole grains, fish, vegs, fruit • Low-income consumers are more likely to be frequent users of fast-food, more likely to live in areas with less physical access to healthier foods Drewnowski, 2007
Socioeconomic factors • Neighborhood residents who have better access to supermarkets and limited access to convenience stores tend to have healthier diets and lower levels of obesity (Larson, 2009) • There are significant disparities in the availability of food • Black and Hispanic neighborhoods had 50% and 70% fewer chain supermarkets compared with white and non-Hispanic neighborhoods, respectively • Shopping at supermarkets vs independent grocers is associated with more frequent F&V intake
Phoenix, AZ Built environment • Definition: All of the physical parts of where we live, work, and play • Built environment can both “facilitate and hinder physical activity and healthful eating” (IOM, 2002) • Evidence of the association between the built environment and obesity is still preliminary Ding & Gebel, 2011
Sedentary behavior and labor-saving devices • Telecommuting • Internet / e-mail • Food deliveries • Pay per view movies • Computer games • Moving sidewalks • Garage door openers • Personal computers • Cellular phones • Escalators/elevators • Drive-in windows • Intercoms • Remote controls • Vacuum robots • ETC
Cortisol stimulates lipoprotein lipase and inhibits hormone sensitive lipase leading to the storage of triglycerides and decreased mobilization of free fatty acids. Glucocorticoids also enhance neuropeptide Y concentration, increasing appetite. Hypothalamus releases CRF; anterior pituitary gland releases ACTH; adrenals release cortisol; many cells release cytokines
Raw mean calories consumed by reactivity group on stress and control days. Cortisol profiles on stress and control sessions across sample Raw mean calories consumed by reactivity group on stress and control days Cortisol reactivity profiles of high and low reactors during stress session Epel et al, 2001
Changes in state anxiety scores (means) over time in the stress and control condition in all subjects (n = 129). *P < 0.05 for differences in time in the stress compared to the control condition (ANOVA repeated measures). Differences in means of energy intake of snack foods (kJ) during stress and control condition in all subjects (n = 129). *P < 0.05 for stress vs. control condition, t-test. Energy intake from sweet foods and total energy intake were significantly higher in the stress condition compared to the control condition, and differences in energy intake stronger in subjects with high disinhibition scores. Rutters et al, 2009
Fasted subjects came twice to randomly complete either a rest or stress condition. Per session, two functional MRI scans were made, wherein the subjects chose the subsequent meal (food images). Putamen activation was decreased postprandially (AUC = -1.2%BOLD s, P<0.05). Sagittal (a), coronal (b) and transversal (c) sections, showing the GLM contrast rest condition versus stress condition. Significant activation in present in the putamen (22, 4, -3 and -23, 11, 4) and the orbitofrontal cortex (-8, 28, -6, P<0.05 FDR corrected). In this study, reward signaling and reward sensitivity were significantly lower under stress, coinciding with increased energy intake from food choice for more crispiness and fullness of taste. The changes in putamen activation may reflect specifically decreased reward prediction Born et al, 2010
Death row nutrition. Curious conclusions of last meals. Wansink et al, 2012, Appetite J Findings: (1) the average last meal is calorically rich (2756 calories) and proportionally averages 2.5 times the daily recommended servings of protein and fat, (2) the most frequent requests are also calorie dense: meat (83.9%), fried food (67.9%), desserts (66.3%), and soft drinks (60.0%), and (3) 39.9% requested branded foods or beverages. These findings are consistent with studies of how food is used to mediate feelings of stress and distress.
Other environmental factors • Do we have a “myopic emphasis on the Big Two”? (Ten Putative Contributors to the Obesity Epidemic, McAllister et al, 2009); • They explored basic, epidemiologic, experimental studies • Examples: • Restaurant dining – While more cals are consumed, they are largely compensated for (Anderson & Matsa 2008) • PA – Some studies report sport participation is up (Salmon et al 2008); PE classes have no appreciable impact (Cawley et al, 2007) • Vending machines – No evidence of contribution to obesity (Faith et al, 2007) We need more research!
Other environmental factors • Infections –human adenoviruses such as Ad-36 can alter metabolism; may impact adipogenesis, leptin, etc • Reproductive fitness – mild-to-moderate obesity may have positive effect on fecundity, thereby passing on genetic predisposition • Assortative mating and ‘floor effects’ – phenotypical mates pass on genetic susceptibility; evidence that the entire BMI distribution shifted to right; increases in underweight prevalence has not paralleled obesity • Ambient temperature – increased usage of climate control results in more time inside, less EE allocated towards maintaining body temperature (Rowe et al 1982; van Hanswijck de Jonge et al 2002) McAllister et al, 2009
Other environmental factors • Sleep debt – amount of sleep in population has decreased over past 40 yrs; can change ghrelin secretion, NPY levels independent of body weight (Barcelo et al, 2004); U shape of BMI vshrs sleep mirrors mortality risk vshr sleep • Endocrine disrupters – wide exposure to chemicals that may interfere with hormone signaling, homeostatic regulation; PBDE, BPA, lipophilic pesticides DDT, atrazine, organo-chlorines (Stahlhut et al, 2007) • Pharmaceuticals – evidence that psychotropics, anti-hypertensives, beta-blockers, antidiabetic agents may contribute to weight gain McAllister et al, 2009