Download
1 / 101
1.01k likes | 1.01k Views
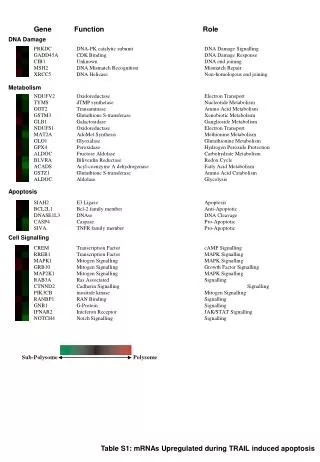
This paper discusses the prediction of indirect DNA damage by simulating metabolic activation of chemicals. It covers the methods, data, and conclusions of the study, including the identification of false positives and false negatives after metabolic activation.

E N D
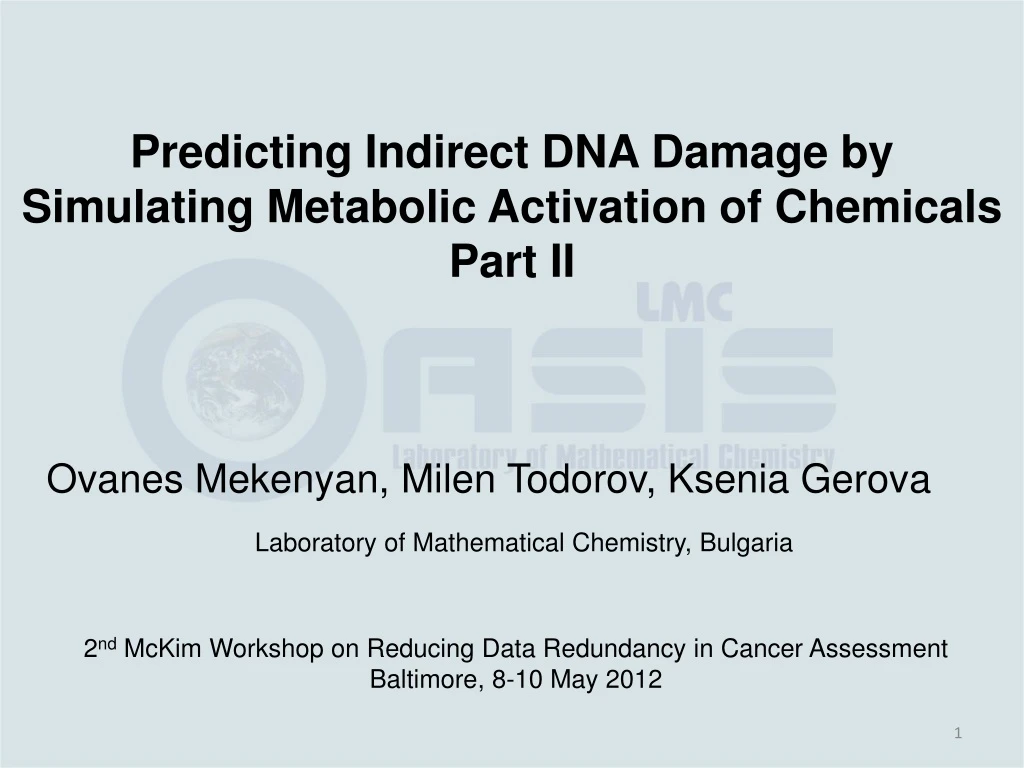
Predicting Indirect DNA Damage by Simulating Metabolic Activation of Chemicals Part II Ovanes Mekenyan, Milen Todorov, Ksenia Gerova Laboratory of Mathematical Chemistry, Bulgaria 2nd McKim Workshop on Reducing Data Redundancy in Cancer Assessment Baltimore, 8-10 May 2012
Outlook • Goal • Methods • Data • Predicting: • AMES mutagenicity without metabolic activation • AMES metabolic activation chemicals negative as parents • Illustrating metabolic activation • False positives after metabolic activation • False negatives after metabolic activation • Conclusions
Data • OASIS database for AMES mutagenicity: • 434 - chemicals mutagenic as parents • 397 - chemicals negative as parents but mutagenic after metabolic activation • 2011 - chemicals negatives as parent and after metabolic activation
Outlook • Goal • Methods • Data • Predicting: • AMES mutagenicity without metabolic activation • AMES metabolic activation chemicals negative as parents • Illustrating metabolic activation • False positives after metabolic activation • False negatives after metabolic activation • Conclusions
Outlook • Goal • Methods • Data • Predicting: • AMES mutagenicity without metabolic activation • AMES metabolic activation of chemicals negative as parents • Illustrating metabolic activation • False positives after metabolic activation • False negatives after metabolic activation • Conclusions
General Flow Diagram for Screening Large Inventories for carcinogenicity Inventory Protein OASIS 151 405 2832 Y 713 38 ChromAb ? MicroNucl ? N Direct DNA reactive Ames Positive w/o S9 Y Bacterial Mutagen In vivo Mammal Tests Y N 2119 308 Generate metabolites Y Y Chemicals with DNA reactive metabolites Ames Positive with S9 Refine TIMES/ Structural alerts 600 ChromAb ? MicroNucl ? N Return for further screening Protein Reactive Oxidative stress? Receptor-Based Epigenetic Screen Low Carcinogenit Potential
General Flow Diagram for Screening Large Inventories for carcinogenicity Inventory Protein OASIS 151 405 2832 Y 713 38 ChromAb ? MicroNucl ? N Direct DNA reactive Ames Positive w/o S9 Y Bacterial Mutagen In vivo Mammal Tests Y N 2119 308 Generate metabolites Y 136 Carcinogenicity data Y Chemicals with DNA reactive metabolites Ames Positive with S9 20 Positive 7 Negative 109 No data Refine TIMES/ Structural alerts 600 ChromAb ? MicroNucl ? N Return for further screening • The data is extracted from the following databases: • Carcinogenic Potency DataBase CPDP • Carcinogenicity & mutagenicity ISSCAN Protein Reactive Oxidative stress? Receptor-Based Epigenetic Screen Low Carcinogenit Potential
General Flow Diagram for Screening Large Inventories for carcinogenicity Inventory Protein OASIS 151 405 2832 Y 713 38 ChromAb ? MicroNucl ? N Direct DNA reactive Ames Positive w/o S9 Y Bacterial Mutagen In vivo Mammal Tests Y N 2119 308 Generate metabolites Y 136 Y Chemicals with DNA reactive metabolites Ames Positive with S9 Refine TIMES/ Structural alerts 600 ChromAb ? MicroNucl ? 464 49 Mutagenic without S9 N 415 Not Mutagenic +/- S9 Return for further screening Protein Reactive Oxidative stress? Receptor-Based Epigenetic Screen Low Carcinogenit Potential
General Flow Diagram for Screening Large Inventories for carcinogenicity Inventory Protein OASIS 151 405 2832 Y 713 38 ChromAb ? MicroNucl ? N Direct DNA reactive Ames Positive w/o S9 Y Bacterial Mutagen In vivo Mammal Tests Y N 2119 308 Generate metabolites Y 136 Y Chemicals with DNA reactive metabolites Ames Positive with S9 33 Refine TIMES/ Structural alerts 600 ChromAb ? MicroNucl ? 464 N Return for further screening Protein Reactive Oxidative stress? Receptor-Based Epigenetic Screen Low Carcinogenit Potential
Second stage analysis for metabolic activation 2119 chemicals with No SA in parent 600 chemicals Have metabolite with DNA binding SA 1519 chemicals Have No SA in parent or metabolites 53.6%of total Database 136 chemicals have positive Ames + S9 415 negative Ames + S9 123 chemicals have positive Ames + S9 1321 chemicals negative Ames + S9 22.7% of AMEs positive are screened by metabolic simulator 46.6% of Chemicals Not Genotoxic A B C D
Second stage analysis for metabolic activation 2119 chemicals with No SA in parent 600 chemicals Have metabolite with DNA binding SA 1519 chemicals Have No SA in parent or metabolites 53.6%of total Database 22.7% of AMEs positive are screened by metabolic simulator 46.6% of Chemicals Not Genotoxic 136 chemicals have positive Ames + S9 415 negative Ames + S9 123 chemicals have positive Ames + S9 1321 chemicals negative Ames + S9 A B C D AMES test consistent with absence of alerts after +S9 AMES test consistent with positive alerts generated after S9 activation
Second stage analysis for metabolic activation 2119 chemicals with No SA in parent 600 chemicals Have metabolite with DNA binding SA 1519 chemicals Have No SA in parent or metabolites 53.6%of total Database 22.7% of AMEs positive are screened by metabolic simulator 46.6% of Chemicals Not Genotoxic 136 chemicals have positive Ames + S9 415 negative Ames + S9 123 chemicals have positive Ames + S9 1321 chemicals negative Ames + S9 A B C D Ames Positive may arise from protein reactivity or errors in SA –`evaluation needed Or without clear genotoxicity mechanism Negative AMES shows simulator Identifies potential for metabolite. Need to balance formation/detoxification
Outlook • Goal • Methods • Data • Predicting: • AMES mutagenicity without metabolic activation • AMES metabolic activation chemicals negative as parents • Illustrating metabolic activation • False positives after metabolic activation • False negatives after metabolic activation • Conclusions
Example 1: Correctly Predicted Metabolic Activation 2,4 dimethylaniline observed AMES positive after metabolic activation (parent negative)
Simulated metabolic activation by rat liver S9 CYP 1A1 CYP 2B2 CYP 1A2 CYP 2B1 CYP 1A1 CYP 2B2 Phase II Phase II CYP 1A1 CYP 2B2 Activated metabolites Documented metabolites Phase II
Simulated metabolic activation by rat liver S9 CYP 1A1 CYP 2B2 CYP 1A2 CYP 2B1 CYP 1A1 CYP 2B2 Phase II Phase II CYP 1A1 CYP 2B2 Activated metabolites Documented metabolites Phase II
Documented metabolite Transformation reaction: Aromatic C-hydroxylation catalyzed by CYP1A1 or CYP2B2* Structural alert: o- and p- Aminophenols and p-Phenylendiamines Interaction mechanism: Electrophilic mechanism – Michael addition * G. Hammons et al., Cancer Research v.45, pp.3578-3585 (1985) M. Butler et al, Cancer Research, v.49, pp.25-31, (1989)
Simulated metabolic activation by rat liver S9 CYP 1A1 CYP 2B2 CYP 1A2 CYP 2B1 CYP 1A1 CYP 2B2 Phase II Phase II CYP 1A1 CYP 2B2 Activated metabolites Documented metabolites Phase II
Metabolite generated by the rat liver S9 metabolism simulator Transformation reaction: Aromatic C-hydroxylation catalyzed by CYP1A1 or CYP2B2* Structural alert: o- and p- Aminophenols and p-Phenylendiamines Interaction mechanism: Electrophilic mechanism – Michael addition * G. Hammons et al., Cancer Research v.45, pp.3578-3585 (1985) M. Butler et al, Cancer Research, v.49, pp.25-31, (1989)
Simulated metabolic activation by rat liver S9 CYP 1A1 CYP 2B2 CYP 1A2 CYP 2B1 CYP 1A1 CYP 2B2 Phase II Phase II CYP 1A1 CYP 2B2 Activated metabolites Documented metabolites Phase II
Metabolite generated by the rat liver S9 metabolism simulator Transformation reaction: N-hydroxylation catalyzed by CYP1A2 or CYP2B1* Structural alert: Hydroxilamines Interaction mechanism: Nitrenium ion formation * G. Hammons et al., Cancer Research v.45, pp.3578-3585 (1985) M. Butler et al, Cancer Research, v.49, pp.25-31, (1989)
Example 2: Correctly Predicted Metabolic Activation 2-acetyl aminofluorene observed AMES positive after metabolic activation (parent negative)
Simulated metabolic activation by rat liver S9 CYP 1A1 CYP 2B1 CYP 1A1 CYP 2B2 3.5.1 CYP 1A2 CYP 2B1 3.5.1 Phase II CYP 1A2 CYP 2B1 CYP 1A2 CYP 2B1 Phase II Phase II Phase II Activated metabolites Documented metabolites
Simulated metabolic activation by rat liver S9 CYP 1A1 CYP 2B1 CYP 1A1 CYP 2B2 3.5.1 CYP 1A2 CYP 2B1 3.5.1 Phase II CYP 1A2 CYP 2B1 CYP 1A2 CYP 2B1 Phase II Phase II Phase II Activated metabolites Documented metabolites
Documented metabolite Transformation reaction: N-hydroxylation catalyzed by CYP1A1 or CYP2B1* Structural alert: Hydroxilamines Interaction mechanism: Nitrenium ion formation *T. Shimada, S. Nakamura. Biochemical Pharmacology, v.36, pp.1979-1987, (1987)
Simulated metabolic activation by rat liver S9 CYP 1A1 CYP 2B1 CYP 1A1 CYP 2B2 3.5.1 CYP 1A2 CYP 2B1 3.5.1 Phase II CYP 1A2 CYP 2B1 CYP 1A2 CYP 2B1 Phase II Phase II Phase II Activated metabolites Documented metabolites
Metabolite generated by the rat liver S9 metabolism simulator Transformation reaction: N-hydroxylation catalyzed by CYP1A1 or CYP2B1* Structural alert: Hydroxilamines Interaction mechanism: Nitrenium ion formation *T. Shimada, S. Nakamura. Biochemical Pharmacology, v.36, pp.1979-1987, (1987)
Simulated metabolic activation by rat liver S9 CYP 1A1 CYP 2B1 CYP 1A1 CYP 2B2 3.5.1 CYP 1A2 CYP 2B1 3.5.1 Phase II CYP 1A2 CYP 2B1 CYP 1A2 CYP 2B1 Phase II Phase II Phase II Activated metabolites Documented metabolites
Metabolite generated by the rat liver S9 metabolism simulator Transformation reaction: Hydrolysis catalyzed by EC 3.5.1.49* Structural alert: Aromatic amines Interaction mechanism: Nitrenium Ion Formation via Enzymatic Activation of Aromatic Amines and N-Hydroxylamines * S. Kitamura et al. Journal of Health Science, v.49, pp. 501-508 (2003)
Simulated metabolic activation by rat liver S9 CYP 1A1 CYP 2B1 CYP 1A1 CYP 2B2 3.5.1 CYP 1A2 CYP 2B1 3.5.1 Phase II CYP 1A2 CYP 2B1 CYP 1A2 CYP 2B1 Phase II Phase II Phase II Activated metabolites Documented metabolites
Metabolite generated by the rat liver S9 metabolism simulator Transformation reaction: N-hydroxylation catalyzed by CYP1A1 or CYP2B1* Structural alert: Hydroxilamines Interaction mechanism: Nitrenium ion formation *T. Shimada, S. Nakamura. Biochemical Pharmacology, v.36, pp.1979-1987, (1987)
Example 3: Correctly Predicted Metabolic Activation 2,5 - Xylidine observed AMES positive after metabolic activation (parent negative)
Simulated metabolic activation by rat liver S9 CYP 1A1 CYP 2B2 CYP 1A2 CYP 2B1 CYP 1A1 CYP 2B2 Phase II Phase II Phase II Activated metabolites Documented metabolites
Simulated metabolic activation by rat liver S9 CYP 1A1 CYP 2B2 CYP 1A2 CYP 2B1 CYP 1A1 CYP 2B2 Phase II Phase II Phase II Activated metabolites Documented metabolites
Documented metabolite Transformation reaction: Aromatic C-hydroxylation catalyzed by CYP1A1 or CYP2B2* Structural alert: o- and p- Aminophenols and p-Phenylendiamines Interaction mechanism: Electrophilic mechanism – Michael addition * G. Hammons et al., Cancer Research v.45, pp.3578-3585 (1985) M. Butler et al, Cancer Research, v.49, pp.25-31, (1989)
Simulated metabolic activation by rat liver S9 CYP 1A1 CYP 2B2 CYP 1A2 CYP 2B1 CYP 1A1 CYP 2B2 Phase II Phase II Phase II Activated metabolites Documented metabolites
Documented metabolite Transformation reaction: N-hydroxylation catalyzed by CYP1A2 or CYP2B1* Structural alert: Hydroxilamines Interaction mechanism: Nitrenium ion formation * G. Hammons et al., Cancer Research v.45, pp.3578-3585 (1985) M. Butler et al, Cancer Research, v.49, pp.25-31, (1989)
Simulated metabolic activation by rat liver S9 CYP 1A1 CYP 2B2 CYP 1A2 CYP 2B1 CYP 1A1 CYP 2B2 Phase II Phase II Phase II Activated metabolites Documented metabolites
Metabolite generated by the rat liver S9 metabolism simulator Transformation reaction: Aromatic C-hydroxylation catalyzed by CYP1A1 or CYP2B2* Structural alert: o- and p- Aminophenols and p-Phenylendiamines Interaction mechanism: Electrophilic mechanism – Michael addition * G. Hammons et al., Cancer Research v.45, pp.3578-3585 (1985) M. Butler et al, Cancer Research, v.49, pp.25-31, (1989)
Example 5: Correctly Predicted Metabolic Activation 2,6 – diamino toluene observed AMES positive after metabolic activation (parent negative)
Simulated metabolic activation by rat liver S9 CYP 1A1 CYP 2B2 CYP 1A2 CYP 2B1 CYP 1A1 CYP 2B2 Phase II Phase II CYP 1A1 CYP 2B2 Activated metabolites Phase II Documented metabolites
Simulated metabolic activation by rat liver S9 CYP 1A1 CYP 2B2 CYP 1A2 CYP 2B1 CYP 1A1 CYP 2B2 Phase II Phase II CYP 1A1 CYP 2B2 Activated metabolites Phase II Documented metabolites
Documented metabolite Transformation reaction: Aromatic C-hydroxylation catalyzed by CYP1A1 or CYP2B2* Structural alert: o- and p- Aminophenols and p-Phenylendiamines Interaction mechanism: Electrophilic mechanism – Michael addition * G. Hammons et al., Cancer Research v.45, pp.3578-3585 (1985) M. Butler et al, Cancer Research, v.49, pp.25-31, (1989)
Simulated metabolic activation by rat liver S9 Phase II Phase II Activated metabolites Phase II Documented metabolites
Metabolite generated by the rat liver S9 metabolism simulator Transformation reaction: Aromatic C-hydroxylation catalyzed by CYP1A1 or CYP2B2* Structural alert: Aromatic amines Interaction mechanism: Nitrenium Ion Formation via Enzymatic Activation of Aromatic Amines and N-Hydroxylamines * G. Hammons et al., Cancer Research v.45, pp.3578-3585 (1985) M. Butler et al, Cancer Research, v.49, pp.25-31, (1989)
Simulated metabolic activation by rat liver S9 Phase II Phase II Activated metabolites Phase II Documented metabolites
Metabolite generated by the rat liver S9 metabolism simulator Transformation reaction: Aromatic C-hydroxilation catalized by CYP1A1 or CYP2B2* Structural alert: o- and p- Aminophenols and p-Phenylendiamines Interaction mechanism: Electrophilic mechanism – Michael addition * G. Hammons et al., Cancer Research v.45, pp.3578-3585 (1985) M. Butler et al, Cancer Research, v.49, pp.25-31, (1989)
Simulated metabolic activation by rat liver S9 Phase II Phase II Activated metabolites Phase II Documented metabolites