Download
1 / 56
601 likes | 651 Views
Decentralization Chapter 9. Adapted by Cynthia Fortin, CPA, CMA Introduction to Managerial Accounting , Brewer , Garrison,Noreen. Video preparation. http://video.wileyaccountingupdates.com/2010/11/02/budgetary-control-and-responsibility-accounting /.

E N D
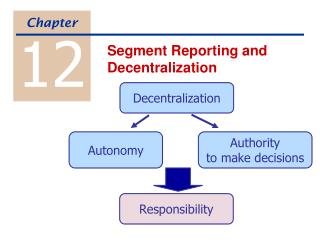
DecentralizationChapter 9 Adapted by Cynthia Fortin, CPA, CMA Introduction to ManagerialAccounting, Brewer, Garrison,Noreen
Videopreparation • http://video.wileyaccountingupdates.com/2010/11/02/budgetary-control-and-responsibility-accounting/ http://video.wileyaccountingupdates.com/2011/08/08/balanced-scorecard/
Benefits of Decentralization • For Lower-level Managers: • Decisions often based on more • updated information • Make better decisions with experience • Can respond quickly to customers • Job satisfaction
Disadvantages of Decentralization • Lower-level Managers may • Make decisions without seeing • Have different objectives • For the organization it may • Be difficult to spread innovative • ideas • Lead to lack of coordination
Cost, Profit, and Investment Centers Cost Center Profit Center Investment Center Cost, profit, and investment centers are all known as responsibility centers. Responsibility Center
Investment Center A segment whose managerhascontrol over costs, revenues, and investments in operating assets. Nike Headquarters
Evaluating an Investment Center -Art Jonak
Net operating income Average operating assets ROI = Return on Investment (ROI) Formula Income before interest and taxes (EBIT) Cash, accounts receivable, inventory, plant and equipment, and other productive assets.
Net Book Value versus Gross Cost Most companies use the Net book value to calculate average operating assets. This method increasesROI over time because accumulated depreciation will increase, lowering the Net book value, therefore lowering the denominator.
Net operating income Average operating assets ROI = ROI = Net operating income Sales Sales Average operating assets × Understanding ROI Margin Turnover ROI =
$30,000 $500,000 $500,000 $200,000 ROI = × ROI = 6% 2.5 = 15% Increasing ROI – An Example Regal Company reports the following: Net operating income $ 30,000 Average operating assets $ 200,000 Sales $ 500,000 Operating expenses $ 470,000
Investing in Operating Assets to Increase Sales Assume that Regal's manager invests in a $30,000 piece of equipment that increases sales by $35,000, while increasing operating expenses by $15,000. Regal Company reports the following: Net operating income $ 50,000 Average operating assets $ 230,000 Sales $ 535,000 Operating expenses $ 485,000
Net operating income Sales Sales Average operating assets ROI = × $50,000 $535,000 $535,000 $230,000 ROI = × ROI = 9.35% 2.33 = 21.8% ROI = Margin Turnover Investing in Operating Assets to Increase Sales ROI increased from 15% to 21.8%.
Without a balanced scorecard, management may not know how to increase ROI. Managers often inherit many committed costs over which they have no control. Managers evaluated on ROI may reject profitable investment opportunities. Criticisms of ROI
Calculating Residual Income ( ) This computation differs from ROI
Residual Income – An Example • The Retail Division of Zephyr, Inc., has average operating assets of $100,000 and is required to earn a return of 20% on these assets. • In the current period, the division earns $30,000. Let’s calculate residual income.
Residual Income – An Example The company earned 30%
Residual income Managersmakeprofitable investments that would be rejected by managers using ROI.
Quick Check Redmond Awnings, a division of Wrap-up Corp., has a netoperating income of $60,000 and average operating assets of $300,000. The required rate of return for the company is 15%. What is the division’s ROI? a. 25% b. 5% c. 15% d. 20%
Quick Check Redmond Awnings, a division of Wrap-up Corp., has a net operating income of $60,000 and average operating assets of $300,000. The required rate of return for the company is 15%. What is the division’s ROI? a. 25% b. 5% c. 15% d. 20% ROI = NOI/Average operating assets = $60,000/$300,000 = 20%
Quick Check If the manager of the division is evaluated based on ROI, will she want to make an investment of $100,000 that would generate additional net operating income of $18,000 per year? a. Yes b. No
Quick Check Redmond Awnings, a division of Wrap-up Corp., has a net operating income of $60,000 and average operating assets of $300,000. If the manager of the division is evaluated based on ROI, will she want to make an investment of $100,000 that would generate additional net operating income of $18,000 per year? a. Yes b. No ROI = $78,000/$400,000 = 19.5% This lowers the division’s ROI from 20.0% down to 19.5%.
Quick Check The company’s required rate of return is 15%. Would the company want the manager of the Redmond Awnings division to make an investment of $100,000 that would generate additional net operating income of $18,000 per year? a. Yes b. No
Quick Check The company’s required rate of return is 15%. Would the company want the manager of the Redmond Awnings division to make an investment of $100,000 that would generate additional net operating income of $18,000 per year? a. Yes b. No ROI = $18,000/$100,000 = 18% The return on the investment exceeds the minimum required rate of return.
Quick Check Redmond Awnings, a division of Wrap-up Corp., has a net operating income of $60,000 and average operating assets of $300,000. The required rate of return for the company is 15%. What is the division’s residual income? a. $240,000 b. $ 45,000 c. $ 15,000 d. $ 51,000
Quick Check Redmond Awnings, a division of Wrap-up Corp., has a net operating income of $60,000 and average operating assets of $300,000. The required rate of return for the company is 15%. What is the division’s residual income? a. $240,000 b. $ 45,000 c. $ 15,000 d. $ 51,000 Net operating income $60,000 Required return (15% of $300,000) (45,000) Residual income $15,000
Quick Check If the manager of the Redmond Awnings division is evaluated based on residual income, will she want to make an investment of $100,000 that would generate additional net operating income of $18,000 per year? a. Yes b. No
Quick Check If the manager of the Redmond Awnings division is evaluated based on residual income, will she want to make an investment of $100,000 that would generate additional net operating income of $18,000 per year? a. Yes b. No Net operating income $78,000 Required return (15% of $400,000) (60,000) Residual income $18,000 Yields an increase of $3,000 in the residual income.
Non Financial Measures • Delivery cycle time • Throughput time • Manufacturing cycle • efficiency (MCE)
Order Received Goods Shipped ProductionStarted Throughput Time Delivery Cycle Time Delivery Performance Measures Process Time + Inspection Time+ Move Time + Queue Time Wait Time MCE = Process time Throughput Time
Quick Check A TQM team at Narton Corp has recorded the following average times for production: Wait 3.0 days Move 0.5 days Inspection 0.4 days Queue 9.3 days Process 0.2 days What is the throughput time? a. 10.4 days. b. 0.2 days. c. 4.1 days. d. 13.4 days.
Quick Check A TQM team at Narton Corp has recorded the following average times for production: Wait 3.0 days Move 0.5 days Inspection 0.4 days Queue 9.3 days Process 0.2 days What is the throughput time? a. 10.4 days. b. 0.2 days. c. 4.1 days. d. 13.4 days. Throughput time = Process + Inspection + Move + Queue = 0.2 days + 0.4 days + 0.5 days + 9.3 days = 10.4 days
Quick Check A TQM team at Narton Corp has recorded the following average times for production: Wait 3.0 days Move 0.5 days Inspection 0.4 days Queue 9.3 days Process 0.2 days What is the Manufacturing Cycle Efficiency (MCE)? a. 50.0%. b. 1.9%. c. 52.0%. d. 5.1%.
Quick Check A TQM team at Narton Corp has recorded the following average times for production: Wait 3.0 days Move 0.5 days Inspection 0.4 days Queue 9.3 days Process 0.2 days What is the Manufacturing Cycle Efficiency (MCE)? a. 50.0%. b. 1.9%. c. 52.0%. d. 5.1%. MCE = Value-added time ÷ Throughput time = Process time ÷ Throughput time = 0.2 days ÷ 10.4 days = 1.9%
Quick Check A TQM team at Narton Corp has recorded the following average times for production: Wait 3.0 days Move 0.5 days Inspection 0.4 days Queue 9.3 days Process 0.2 days What is the delivery cycle time (DCT)? a. 0.5 days. b. 0.7 days. c. 13.4 days. d. 10.4 days.
Quick Check A TQM team at Narton Corp has recorded the following average times for production: Wait 3.0 days Move 0.5 days Inspection 0.4 days Queue 9.3 days Process 0.2 days What is the delivery cycle time (DCT)? a. 0.5 days. b. 0.7 days. c. 13.4 days. d. 10.4 days. DCT = Wait time + Throughput time = 3.0 days + 10.4 days = 13.4 days
Management translates its strategy into performance measures that employees understand and influence.
What are ourfinancial goals? What customers do we want to serve andhow are we going towin and retain them? What internal busi-ness processes arecritical to providingvalue to customers?
The Balanced Scorecard for Individuals The entire organization should have an overall balanced scorecard. Each individual should have a personal balanced scorecard.
Top right 3rd left 2nd bottom right
Top right Score: 8,3% Revenue per available Room Current 80,3 Target 90,4 Description: this indicator is for measuring the average revenue per room
3rd right Score: 24,4% % of paid occupancy Current 24,4 Target 94 Description: this indicator is for measuring the customer that pay at checkout …
2nd bottom right Score: 3,6 Average length of stay per customer Current 3,6 Target 8,8 Description: this indicator is for measuring the average number of nights per customer
Then The Balanced Scorecard : If …. Then … happens cause-and-effect basis If we improveone performancemeasure . . . Another desiredperformance measurewill improve. The balanced scorecard lays out concrete actions to attain desired outcomes.
The Balanced Scorecard and Compensation Incentive compensation should be linked to balanced scorecard performance measures.