Download

1 / 62
620 likes | 629 Views
DECENTRALIZATION Chapter 9. Introduction to Managerial Accounting, Brewer, Garrison,Noreen Power Points from website - a dapted by Cynthia Fortin, CPA, CMA. http://highered.mheducation.com/sites/0078025419/student_view0/chapter12/index.html.

E N D
DECENTRALIZATION Chapter 9 Introduction to Managerial Accounting, Brewer, Garrison,Noreen Power Points from website - adapted by Cynthia Fortin, CPA, CMA http://highered.mheducation.com/sites/0078025419/student_view0/chapter12/index.html
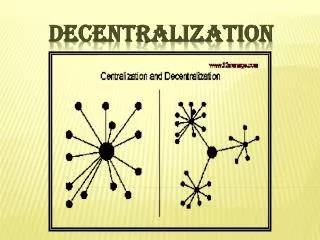
Some decisions must be delegated to lower level managers because Leaders cannot handle all day to day decisions. Delegation Weak Strong Little
Shareholders delegate decisions • To Top level managers – • Who could abuse their trust • So Shareholders rely on • Performance figures • - Stock market price
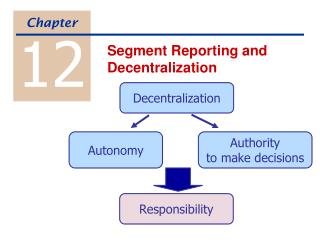
What are the benefits of Decentralization? • For Lower-level Managers: • Decisions often based on more • updated information • Make better decisions with experience • Can respond quickly to customers • Job satisfaction
What are the Disadvantages of Decentralization? • Lower-level Managers may • Make decisions without seeing • Have different objectives • For the organization it may • Be difficult to spread innovative • ideas • Lead to lack of coordination
Cost Center Profit Center Investment Center Cost, profit, and investment centers are all known as responsibility centers. Managers must have control over Cost, profit, and investment decisions in order to be held accountable. Responsibility Center
Cost Center • Examples • Accounting, Finance, • Administration • Legal • Human Resources • Tools used to evaluate Managers: • Standard Cost Variances • Flexible budget variances
Profit Center • Managers have control • over Costs and Revenue • Tools used to evaluate Managers: • Comparing Actual profit to • Budgeted Profit
Investment Center • Managers have control • over Costs, Revenue and • Investments in Operating Assets. • Tools used to evaluate Managers: • Return on Investment • Residual Income
Net operating income Average operating assets ROI = Return on Investment (ROI) Formula Income before interest and taxes (EBIT) Cash, accounts receivable, inventory, plant and equipment, and other productive assets.
Net Book Value versus Gross Cost Most companies use the Net book value to calculate average operating assets. This method increasesROI over time because accumulated depreciation will increase, lowering the Net book value, therefore lowering the denominator.
Net operating income Average operating assets ROI = ROI = Net operating income Sales Sales Average operating assets × Understanding ROI Margin Turnover ROI = Breaking it down helps Managers to take actions to improve.
$30,000 $500,000 $500,000 $200,000 ROI = × ROI = 6% 2.5 = 15% Increasing ROI – An Example Regal Company reports the following: Net operating income $ 30,000 Average operating assets $ 200,000 Sales $ 500,000 Operating expenses $ 470,000
Investing in Operating Assets to Increase Sales Assume that Regal's manager invests in a $30,000 piece of equipment that increases sales by $35,000, while increasing operating expenses by $15,000. Regal Company reports the following: Net operating income $ 50,000 Average operating assets $ 230,000 Sales $ 535,000 Operating expenses $ 485,000
Net operating income Sales Sales Average operating assets ROI = × $50,000 $535,000 $535,000 $230,000 ROI = × ROI = 9.35% 2.33 = 21.8% ROI = Margin Turnover Investing in Operating Assets to Increase Sales ROI increased from 15% to 21.8%.
Without a balanced scorecard, management may not know how to increase ROI. Managers often inherit many committed costs over which they have no control. Managers evaluated on ROI may reject profitable investment opportunities. Criticisms of ROI
Calculating Residual Income ( ) This computation differs from ROI ROI measures net operating income earned relative to the investment in average operating assets. Residual income measures net operating income earned less the minimum required return on average operating assets.
DEFINITION OF 'REQUIRED RATE OF RETURN - RRR' • The minimum annual percentage earned by an investment that will induce individuals or companies to put money into a particular security or project. • Investors use the RRR to decide where to put their money by comparing the return of an investment to all other available options. • Taking the risk-free rate of return, inflation and liquidity into consideration, the RRR affects the maximum price they are willing to pay for a stock. • The RRR is also used in calculations of net present value in discounted cash flow analysis.
Residual Income – An Example Let’s calculate residual income. The Retail Division of Zephyr, Inc., has average operating assets of $100,000 and is required to earn a return of 20% on these assets. In the current period, the division earns $30,000.
Residual Income – An Example The company earned 30%
Residual income Managersmakeprofitable investments that would be rejected by managers using ROI.
Quick Check Redmond Awnings, a division of Wrap-up Corp., has a netoperating income of $60,000 and average operating assets of $300,000. The required rate of return for the company is 15%. What is the division’s ROI? a. 25% b. 5% c. 15% d. 20%
Quick Check ROI = NOI/Average operating assets = $60,000/$300,000 = 20% Redmond Awnings, a division of Wrap-up Corp., has a net operating income of $60,000 and average operating assets of $300,000. The required rate of return for the company is 15%. What is the division’s ROI? a. 25% b. 5% c. 15% d. 20%
Quick Check If the manager of the division is evaluated based on ROI, will she want to make an investment of $100,000 that would generate additional net operating income of $18,000 per year? a. Yes b. No
Quick Check ROI = $78,000/$400,000 = 19.5% This lowers the division’s ROI from 20.0% down to 19.5%. Redmond Awnings, a division of Wrap-up Corp., has a net operating income of $60,000 and average operating assets of $300,000. If the manager of the division is evaluated based on ROI, will she want to make an investment of $100,000 that would generate additional net operating income of $18,000 per year? a. Yes b. No
Quick Check The company’s required rate of return is 15%. Would the company want the manager of the Redmond Awnings division to make an investment of $100,000 that would generate additional net operating income of $18,000 per year? a. Yes b. No
Quick Check ROI = $18,000/$100,000 = 18% The return on the investment exceeds the minimum required rate of return. The company’s required rate of return is 15%. Would the company want the manager of the Redmond Awnings division to make an investment of $100,000 that would generate additional net operating income of $18,000 per year? a. Yes b. No
Quick Check Redmond Awnings, a division of Wrap-up Corp., has a net operating income of $60,000 and average operating assets of $300,000. The required rate of return for the company is 15%. What is the division’s residual income? a. $240,000 b. $ 45,000 c. $ 15,000 d. $ 51,000
Quick Check Net operating income $60,000 Required return (15% of $300,000) (45,000) Residual income $15,000 Redmond Awnings, a division of Wrap-up Corp., has a net operating income of $60,000 and average operating assets of $300,000. The required rate of return for the company is 15%. What is the division’s residual income? a. $240,000 b. $ 45,000 c. $ 15,000 d. $ 51,000
Quick Check If the manager of the Redmond Awnings division is evaluated based on residual income, will she want to make an investment of $100,000 that would generate additional net operating income of $18,000 per year? a. Yes b. No
Quick Check Net operating income $78,000 Required return (15% of $400,000) (60,000) Residual income $18,000 Yields an increase of $3,000 in the residual income. If the manager of the Redmond Awnings division is evaluated based on residual income, will she want to make an investment of $100,000 that would generate additional net operating income of $18,000 per year? a. Yes b. No
Comparinginvestment centers 4 x bigger Absolute number Cannot use Residual Income to compare performance of divisions of different sizes. Because the result is an absolute amount. It is best to focus on the % of change in Residual Income year to year.
Non Financial Measures What drives sales higher? • Improving quality • Exposing potential customers to the product • Filling customer orders on time
Non Financial Measures • Delivery cycle time • Throughput time • Manufacturing cycle efficiency (MCE)
Delivery cycle time • Time from when a customer order is received to when the completed order is shipped. • Important concern to many customers, who would like the delivery cycle time to be as short as possible. • Cutting the delivery cycle time may give a company a key competitive advantage—and may be necessary for survival.
Throughput time Time required to turn raw materials into completed products is called throughput time or manufacturing cycle time.
Throughput time includes • Process time is the amount of time work is actually done on the product. • Inspection time is the amount of time spent ensuring that the product is not defective. • Move time is the time required to move materials or partially completed products from workstation to workstation. • Queue time is the amount of time a product spends waiting to be worked on, to be moved, to be inspected, or to be shipped.
Manufacturing Cycle Efficiency (MCE) • Non–value-added activities such as inspecting, moving, and queuing, can be reduced to only a fraction of previous levels. • Delivery cycle time can be reduced from months to only weeks or hours. • Throughput time, which is a key measure in delivery performance, can be put into better perspective by computing the manufacturing cycle efficiency (MCE). • The MCE is computed by relating the value-added time to the throughput time. The formula is
Quick Check A TQM team at Narton Corp has recorded the following average times for production: Wait 3.0 days Move 0.5 days Inspection 0.4 days Queue 9.3 days Process 0.2 days What is the throughput time? a. 10.4 days. b. 0.2 days. c. 4.1 days. d. 13.4 days.
Quick Check Throughput time = Process + Inspection + Move + Queue = 0.2 days + 0.4 days + 0.5 days + 9.3 days = 10.4 days A TQM team at Narton Corp has recorded the following average times for production: Wait 3.0 days Move 0.5 days Inspection 0.4 days Queue 9.3 days Process 0.2 days What is the throughput time? a. 10.4 days. b. 0.2 days. c. 4.1 days. d. 13.4 days.
Quick Check A TQM team at Narton Corp has recorded the following average times for production: Wait 3.0 days Move 0.5 days Inspection 0.4 days Queue 9.3 days Process 0.2 days What is the Manufacturing Cycle Efficiency (MCE)? a. 50.0%. b. 1.9%. c. 52.0%. d. 5.1%.
Quick Check MCE = Value-added time ÷ Throughput time = Process time ÷ Throughput time = 0.2 days ÷ 10.4 days = 1.9% A TQM team at Narton Corp has recorded the following average times for production: Wait 3.0 days Move 0.5 days Inspection 0.4 days Queue 9.3 days Process 0.2 days What is the Manufacturing Cycle Efficiency (MCE)? a. 50.0%. b. 1.9%. c. 52.0%. d. 5.1%.
Quick Check A TQM team at Narton Corp has recorded the following average times for production: Wait 3.0 days Move 0.5 days Inspection 0.4 days Queue 9.3 days Process 0.2 days What is the delivery cycle time (DCT)? a. 0.5 days. b. 0.7 days. c. 13.4 days. d. 10.4 days.
Quick Check DCT = Wait time + Throughput time = 3.0 days + 10.4 days = 13.4 days A TQM team at Narton Corp has recorded the following average times for production: Wait 3.0 days Move 0.5 days Inspection 0.4 days Queue 9.3 days Process 0.2 days What is the delivery cycle time (DCT)? a. 0.5 days. b. 0.7 days. c. 13.4 days. d. 10.4 days.
A balanced scorecard consists of an integrated set of performance measures that are derived from and support a company's strategy. A strategy is essentially a theory about how to achieve the organization's goals
Management translates its strategy into performance measures that employees understand and influence. For example, the amount of time passengers have to wait in line to have their baggage checked at an airport might be a performance measure for the supervisor in charge of an airline.