Download
1 / 23
230 likes | 417 Views
More Powerful Genome-wide Association Methods for Case-control Data. Robert C. Elston, PhD Case Western Reserve University Cleveland Ohio. Kim S, Morris NJ, Won S, Elston RC Genetic Epidemiology, in press.

E N D
More Powerful Genome-wide Association Methods for Case-control Data Robert C. Elston, PhD Case Western Reserve University Cleveland Ohio
Kim S, Morris NJ, Won S, Elston RC Genetic Epidemiology, in press Single-marker and two-marker association tests for unphased case-control genotype data, with a power comparison
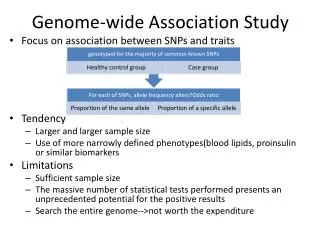
Introduction • A genome-wide association study with case-control data aims to localize disease susceptibility regions in the genome • Single Nucleotide Polymorphism (SNP) markers, which are usually diallelic, have been used to cover the whole genome • Two categories of tests have been applied to these data • single marker association tests, which examine association between affection status and the SNP data one SNP at a time • multi-marker association tests, which examine association between affection status and multiple SNP data simultaneously
Information for association • Allele frequency trend test Association Analysis HWD trend test Allele LD contrast test a d. genotype frequency test HWD LD d e haplotype-based test with HWE g b c f f. ??? g. phase-known genotype-based test
The allele frequency, HWD and LD contrast tests are typically developed in what has been termed a retrospective context; i.e. case-control status is considered fixed and the genotypes are considered random • For case-control data, epidemiologists typically take advantage of the properties of the odds ratio and use the prospective logistic regression model, making the case-control status the random variable dependent on the predictors • Prospective modeling tends to allow for greater flexibility, especially when adjusting for covariates • It also provides a natural way to adjust for any correlations between the tests or other covariates, and can be extended to quantitative traits
Notation and Assumptions • We suppose there are two diallelic SNP markers, A and B having alleles {A1,A2} and {B1,B2}, respectively, where A1 and B1 are the minor alleles • IcaseandIctrldenote the sets of cases and controls • We make minimal assumptions about the general population sampled; in particular, we do not assume HWE in the population • μX, andσXYdenote the expected value of X, the variance of X and the covariance of X and Y, respectively
The HWD parameter for marker A is given by • The HWD parameter can be expressed as • This means that the HWD parameter, dA, is half the deviation of the variance from the variance expected under HWE • The composite LD parameter for alleles A1 and B1 of markers A and B is
The joint test of allele frequency and HWD contrasts between cases and controls tests the null hypothesis H0: (pA|casedA|case) = (pA|ctrldA|ctrl) • Let Zi= (Xi )’; the sample mean Z is a sufficient statistic for (pAdA)’ • The Allelic-HWD contrast test can be performed by comparing Zcase and Zctrl. The T2 statistic for this test is _ _ _
_ Z • Let Zi = (Xi YiXiYi)’; is a sufficient statistic for (pApBΔ)’ • The Allelic-LD contrast test can be performed using a version of Hotelling’s T2 • The additional case-control differences can be captured by the HWD and LD contrast tests, given the allele frequency contrast(s) • The Allelic-HWD-LD contrast test can be constructed in a similar manner by contrasting the mean vector of Zi = (Xi YiXiYi )’ between cases and controls
Single-marker and two-marker association tests with corresponding models and hypotheses
Multistage Tests • “Self-replication” if the tests are independent • Sequential tests E.g. The HWD contrast test adjusted for allele frequency information which is used in the first stage can be performed by the test of
Penetrance Model and True Marker Association Model • Let D denote the disease genotype variable coded as • We write the penetrance model as:
Given the true disease model and the LD structure, we can set up the true single-marker associationmodel between the phenotype and single-marker data X: • This true association model has the same form as the penetrance model • When (1 – 2pD) - ≠ 0, the coefficient of the • quadratic terms generally approaches 0 faster than does that of the linear term γD γD2
Power Computation • T2 test in a retrospective model and the score test and LRT in a prospective logistic model are expected to perform similarly • The noncentrality parameter of the T2 test for test 2-5 is • The noncentrality parameters for the other tests can be obtained by using the corresponding sub-matrices of (μcase – μctrl) and (Σcase + Σctrl) • Then
Comparisons of theoretical and empirical power of test 1-2 For each of the four disease models, parameters were set as follows: pD = 0.2, pA = 0.3, K = 0.05, DXD = 0.048(D’ = 0.8), n = 2,000 (500 for recessive), α = 0.05/500,000 Empirical power is obtained by the ratio of the number of rejected replicates to the total 100,000 replicates.
Power Comparisons on Real Data • We estimated LD parameters and marker allele frequencies from the HapMap CEU population • The data consist of 120 haplotypes estimated from 30 parent-offspring trios • We split chromosome 11 into mutually exclusive consecutive regions containing 3 SNPs each • For each region we estimated the LD and allele frequency parameters • We excluded regions where the minor allele frequencies of three consecutive markers were less than 0.1, leaving 4,648 regions • We chose the disease SNP to be the one with the smallest allele frequency • Parameters other than the allele frequency and LD parameters were set to be the same as before
Conclusions • The best two marker test always appear to be more powerful than either the best single-marker test or the haplotype-based test • It should be possible, by examining the LD structure of the markers, to predict which will be the best two-marker test to perform • We need to study > two marker tests
http://darwin.case.edu/sage.html http://darwin.case.edu/