Download
1 / 28
290 likes | 434 Views
Genome-wide association studies. Usman Roshan. SNP. Single nucleotide polymorphism Specific position and specific chromosome. SNP genotype. Suppose this is the DNA on chromosome 1 starting from position 1.

E N D
Genome-wide association studies Usman Roshan
SNP • Single nucleotide polymorphism • Specific position and specific chromosome
SNP genotype Suppose this is the DNA on chromosome 1 starting from position 1. There is a SNP C/G on position 5, C/T on position 14, and G/T on position 21. This person is heterozygous in the first SNP and homozygous in the other two. F: AACACAATTAGTACAATTATGAC M: AACAGAATTAGTACAATTATGAC
SNP genotype representation The example F: AACACAATTAGTACAATTATGAC M: AACAGAATTAGTACAATTATGAC is represented as CG CC GG …
SNP genotype • For several individuals A/T C/T G/T … H0: AA TT GG … H1: AT CC GT … H2: AA CT GT … . . .
SNP genotype encoding • If SNP is A/B (alphabetically ordered) then count number of times we see B. • Previous example becomes A/T C/T G/T … A/T C/T G/T … H0: AA TT GG … 0 2 0 … H1: AT CC GT … =>1 0 1 … H2: AA CT GT … 0 1 1 … Now we have data in numerical format
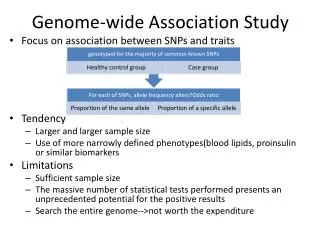
Genome wide association studies (GWAS) • Aim to identify which regions (or SNPs) in the genome are associated with disease or certain phenotype. • Design: • Identify population structure • Select case subjects (those with disease) • Select control subjects (healthy) • Genotype a million SNPs for each subject • Determine which SNP is associated.
Example GWAS A/T C/G A/G … Case 1 AA CC AA Case 2 AT CG AA Case 3 AA CG AA Control 1 TT GG GG Control 2 TT CC GG Control 3 TA CG GG
Encoded data A/T C/G A/G A/T C/G A/G Case1 AA CC AA 0 0 0 Case2 AT CG AA 1 1 0 Case3 AA CG AA => 0 1 0 Con1 TT GG GG 2 2 2 Con2 TT CC GG 2 0 2 Con3 TA CG GG 1 1 2
Ranking SNPs SNP1 SNP2 SNP3 SNP1 SNP2 SNP3 A/T C/G A/G A/T C/G A/G Case1 AA CC AA 0 0 0 Case2 AT CG AA 1 1 0 Case3 AA CG AA => 0 1 0 Con1 TT GG GG 2 2 2 Con2 TT CC GG 2 0 2 Con3 TA CG GG 1 1 2 A good ranking strategy would produce SNP3, SNP1, SNP2
Chi-square test • Gold standard is the univariate non-parametric chi-square test with two degrees of freedom. • Search for SNPs that deviate from the independence assumption. • Rank SNPs by p-values
#Allele1 #Allele2 Case 10 90 2 98 Control Case-control example • Study of 100 people: • Case: 50 subjects with cancer • Control: 50 subjects without cancer • Count number of alleles and form a 2x2 contingency table • Relative risk: RR = Pr(disease | one copy of risk allele)/ Pr(disease | zero copies of risk allele) (Jewell ‘03) • Due to sampling we cannot estimate the relative risk from a case-control study • But we can estimate the odds-ratio
Odds of an event A is defined as Odds(A)= Pr(A)/Pr(~A) Odds ratio is the ratio of two odds. For example the ratio of odds of A and B is OR = Odds(A)/Odds(B) = Pr(A)/Pr(~A) / Pr(B)/Pr(~B) Odds ratio of disease and exposed and unexposed groups would be OR = Odds(D|G=1)/Odds(D|G=0) = = Pr(D|G=1)/Pr(~D|G=1) / Pr(D|G=0)/Pr(~D|G=0) = Pr(D|G=1)/Pr(D|G=0) x Pr(~D|G=0)/Pr(~D|G=1) = RR x Pr(~D|G=0)/Pr(~D|G=1) Odds ratio
The odds ratio is symmetric in disease and genotype: OR = Odds(D|G=1)/Odds(D|G=0) = = Odds(G|D=1)/Odds(G|D=0) Great! Because we can estimate P(G|D) from a case control study. We can now use the OR as an estimate of one’s risk of disease. Symmetry in odds ratio
#Allele1 (risk) #Allele2 (wildtype) Case 10 90 2 98 Control Example • Odds of risk allele in case = (10/100)/(90/100)=1/9 • Odds of risk allele in control = (2/100)/(98/100)=1/49 • Odds ratio of risk allele = 49/9
Okay, so the OR measures the risk. But is it significant? Perhaps it is due to chance. Let’s look at the chi-square test for measuring significance. What about significance?
Statistical test of association (P-values) • P-value = probability of the observed data (or worse) under the null hypothesis • Example: • Suppose we are given a series of coin-tosses • We feel that a biased coin produced the tosses • We can ask the following question: what is the probability that a fair coin produced the tosses? • If this probability is very small then we can say there is a small chance that a fair coin produced the observed tosses. • In this example the null hypothesis is the fair coin and the alternative hypothesis is the biased coin
Binomial distribution • Bernoulli random variable: • Two outcomes: success of failure • Example: coin toss • Binomial random variable: • Number of successes in a series of independent Bernoulli trials • Example: • Probability of heads=0.5 • Given four coin tosses what is the probability of three heads? • Possible outcomes: HHHT, HHTH HTHH, HHHT • Each outcome has probability = 0.5^4 • Total probability = 4 * 0.5^4
Binomial distribution • Bernoulli trial probability of success=p, probability of failure = 1-p • Given n independent Bernoulli trials what is the probability of k successes? • Binomial applet: http://www.stat.tamu.edu/~west/applets/binomialdemo.html
Hypothesis testing under Binomial hypothesis • Null hypothesis: fair coin (probability of heads = probability of tails = 0.5) • Data: HHHHTHTHHHHHHHTHTHTH • P-value under null hypothesis = probability that #heads >= 15 • This probability is 0.021 • Since it is below 0.05 we can reject the null hypothesis
#Allele1 (risk) #Allele2 (wildtype) Case c1 (X1) c2 (X2) c3 (X3) c4 (X4) Control Chi-square statistic • Define four random variables Xi each of which is binomially distributed Xi ~ B(n, pi) where n=c1+c2+c3+c4 is the total number of subjects and pi is the probability of success of Xi. • Each variable Xi represents the number of case and control subjects with number of risk and wildtype alleles. • The expected value E(Xi) = npi since each Xi is binomial.
Chi-square statistic Define the statistic: where ci = observed frequency for ith outcome ei = expected frequency for ith outcome n = total outcomes The probability distribution of this statistic is given by the chi-square distribution with n-1 degrees of freedom. Proof can be found at http://ocw.mit.edu/NR/rdonlyres/Mathematics/18-443Fall2003/4226DF27-A1D0-4BB8-939A-B2A4167B5480/0/lec23.pdf Great. But how do we use this to get a SNP p-value?
#Allele1 (risk) #Allele2 (wildtype) Case c1 c2 Control c3 c4 Null hypothesis for case control contingency table • We have two random variables: • D: disease status • G: allele type. • Null hypothesis: the two variables are independent of each other (unrelated) • Under independence • P(D,G)= P(D)P(G) • P(D=case) = (c1+c2)/n • P(G=risk) = (c1+c3)/n • Expected values • E(X1) = P(D=case)P(G=risk)n • We can calculate the chi-square statistic for a given SNP and the probability that it is independent of disease status (using the p-value). • SNPs with very small probabilities deviate significantly from the independence assumption and therefore considered important.
#Allele1 #Allele2 Case 15 35 Control 2 48 Chi-square statistic exercise • Compute expected values and chi-square statistic • Compute chi-square p-value by referring to chi-square distribution
Logistic regression • The odds ratio estimated from the contingency table directly has a skewed sampling distribution. • A better (discriminative) approach is to model the log likelihood ratio log(Pr(G|D=case)/Pr(G|D=control)) as a linear function. In other words: • Why: • Log likelihood ratio is a powerful statistic • Modeling as a linear function yields a simple algorithm to estimate parameters • G is number of copies of the risk allele • With some manipulation this becomes
How do we get the odds ratio from logistic regression? (I) • Using Bayes rule we have By exponentiating both sides we get And by taking the ratio with G=1 and G=0 we get
How do we get the odds ratio from logistic regression? (II) Continued from previous slide: by rearranging the terms in the numerator and denominator we get By symmetry of odds ratio this is Since the original ratio (see previous slide) is equal to ew and is equal to the odds ratio we conclude that the odds ratio is given by this value.
How to find w and w0? • And so ew is our odds ratio. But how do we find w and w0? • We assume that one’s disease status D given their genotype G is a Bernoulli random variable. • Using this we form the sample likelihood • Differentiate the likelihood by w and w0 • Use gradient descent