Download
1 / 1
10 likes | 120 Views
Effects of Visual Feedback of Speech on Fluency in Autism Spectrum Disorders Dana Githmark Keene State College. RESULTS. BACKGROUND. MATERIALS AND METHODS. DSM IV Classifications of Pervasive Developmental Disorders (Autism, Asperger’s, PDD-NOS)

E N D
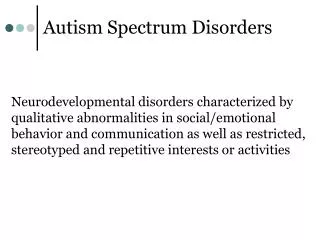
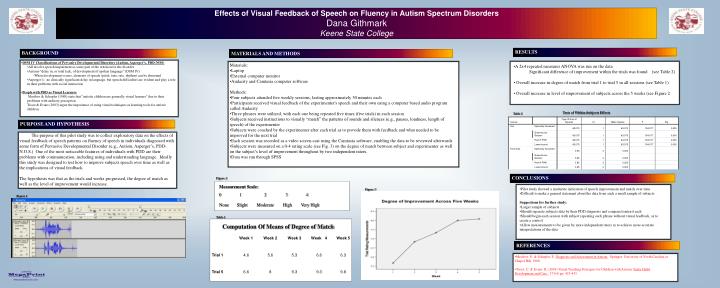
Effects of Visual Feedback of Speech on Fluency in Autism Spectrum Disorders Dana Githmark Keene State College RESULTS BACKGROUND MATERIALS AND METHODS • DSM IV Classifications of Pervasive Developmental Disorders (Autism, Asperger’s, PDD-NOS) • All involve speech impairment as some part of the criterion for the disorder • Autism-“delay in, or total lack, of development of spoken language” (DSM IV) • -When development occurs, elements of speech (pitch, tone, rate, rhythm) can be abnormal • Asperger’s- no clinically significant delay in language, but speech difficulties are evident and play a role in their problems with social interaction • People with PDD as Visual Learners • Mesibov & Schopler (1988) state that “autistic children are generally visual learners” due to their problems with auditory perception. • Tissot & Evans (2003) argue the importance of using visual techniques as learning tools for autistic children • A 2x4 repeated measures ANOVA was run on the data • Significant difference of improvement within the trials was found (see Table 2) • Overall increase in degree of match from trial 1 to trial 5 in all sessions (see Table 1) • Overall increase in level of improvement of subjects across the 5 weeks (see Figure 2 • Materials: • Laptop • External computer monitor • Audacity and Camtasia computer software • Methods: • Four subjects attended five weekly sessions, lasting approximately 30 minutes each • Participants received visual feedback of the experimenter's speech and their own using a computer based audio program called Audacity • Three phrases were utilized, with each one being repeated five times (five trials) in each session • Subjects received instructions to visually “match” the patterns of sounds and silences (e.g., pauses, loudness, length of speech) of the experimenter • Subjects were coached by the experimenter after each trial as to provide them with feedback and what needed to be improved for the next trial • Each session was recorded as a video screen-cast using the Camtasia software, enabling the data to be reviewed afterwards • Subjects were measured on a 0-4 rating scale (see Fig. 3) on the degree of match between subject and experimenter as well on the subject’s level of improvement throughout by two independent raters. • Data was run through SPSS Tests of Within-Subjects Effects Table 2 PURPOSE AND HYPOTHESIS The purpose of this pilot study was to collect exploratory data on the effects of visual feedback of speech patterns on fluency of speech in individuals diagnosed with some form of Pervasive Developmental Disorder (e.g., Autism, Asperger’s, PDD-N.O.S.) One of the most noticeable features of individuals with PDD are their problems with communication, including using and understanding language. Ideally this study was designed to test how to improve subjects speech over time as well as the implications of visual feedback. The hypothesis was that as the trials and weeks progressed, the degree of match as well as the level of improvement would increase. CONCLUSIONS Figure 2 Measurement Scale: 0 1 2 3 4 None Slight Moderate High Very High • Pilot study showed a moderate indication of speech improvement and match over time • Difficult to make a general statement about the data from such a small sample of subjects • Suggestions for further study: • Larger sample of subjects • Should separate subjects data by their PDD diagnosis and compare/contrast each • Should begin each session with subject repeating each phrase without visual feedback, as to create a control • Allow measurements to be given by more independent raters as to achieve more accurate interpretations of the data Figure 3 Figure 1 Table 1 Computation Of Means of Degree of Match REFERENCES • Mesibov, G. & Schopler, E. Diagnosis and Assessment in Autism. Springer: University of North Carolina at Chapel Hill. 1988. • Tissot, C. & Evans, R. (2003) Visual Teaching Strategies for Children with Autism. Early Child • Development and Care. 173(4) pp. 425-433.