Download
1 / 7
70 likes | 72 Views
"Drought occurrence is caused by the breaking of water balance, which usually leads to negative impact on agriculture, as well as ecological and socio economic spheres. The main purpose of the current study is to conduct drought assessment over Kano State, Nigeria for 2018. We used two different drought indices including Standardized Precipitation Index SPI and the Normalized Difference Vegetation Index NDVI . Meteorological data on precipitation was used to compute the Standardized Precipitation Index, and Normalized Difference Vegetation Index was generated from MODIS NDVI data sets. The conventional SPI classification scheme which categorize drought under seven groups was used along with the NDVI values which ranges from 1 to 1. Results indicate a near normal condition in the study area. Ezekiel. O. Eguaroje | Thomas. U. Omali | Kebiru Umoru ""Assessment of Drought Occurrence in Kano State, Nigeria"" Published in International Journal of Trend in Scientific Research and Development (ijtsrd), ISSN: 2456-6470, Volume-4 | Issue-2 , February 2020, URL: https://www.ijtsrd.com/papers/ijtsrd29976.pdf<br><br>Paper Url : https://www.ijtsrd.com/other-scientific-research-area/enviormental-science/29976/assessment-of-drought-occurrence-in-kano-state-nigeria/ezekiel-o-eguaroje"<br>

E N D
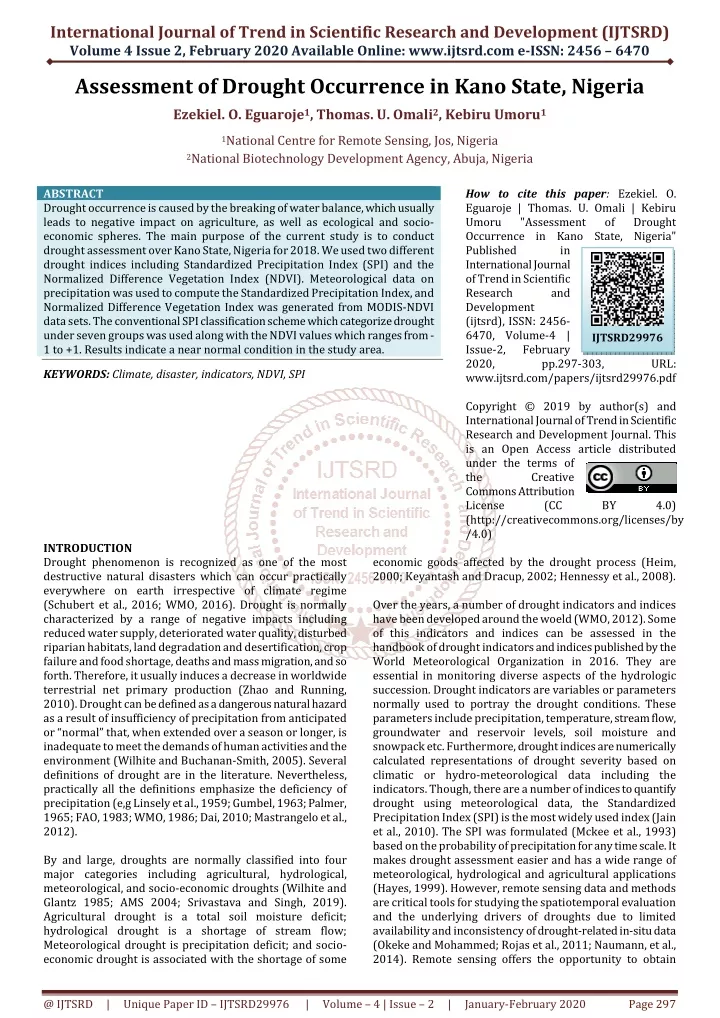
International Journal of Trend in Scientific Research and Development (IJTSRD) Volume 4 Issue 2, February 2020 Available Online: www.ijtsrd.com e-ISSN: 2456 – 6470 Assessment of Drought Occurrence in Kano State, Nigeria Ezekiel. O. Eguaroje1, Thomas. U. Omali2, Kebiru Umoru1 1National Centre for Remote Sensing, Jos, Nigeria 2National Biotechnology Development Agency, Abuja, Nigeria ABSTRACT Drought occurrence is caused by the breaking of water balance, which usually leads to negative impact on agriculture, as well as ecological and socio- economic spheres. The main purpose of the current study is to conduct drought assessment over Kano State, Nigeria for 2018. We used two different drought indices including Standardized Precipitation Index (SPI) and the Normalized Difference Vegetation Index (NDVI). Meteorological data on precipitation was used to compute the Standardized Precipitation Index, and Normalized Difference Vegetation Index was generated from MODIS-NDVI data sets. The conventional SPI classification scheme which categorize drought under seven groups was used along with the NDVI values which ranges from - 1 to +1. Results indicate a near normal condition in the study area. KEYWORDS: Climate, disaster, indicators, NDVI, SPI How to cite this paper: Ezekiel. O. Eguaroje | Thomas. U. Omali | Kebiru Umoru "Assessment Occurrence in Kano State, Nigeria" Published in International Journal of Trend in Scientific Research and Development (ijtsrd), ISSN: 2456- 6470, Volume-4 | Issue-2, February 2020, pp.297-303, www.ijtsrd.com/papers/ijtsrd29976.pdf Copyright © 2019 by author(s) and International Journal of Trend in Scientific Research and Development Journal. This is an Open Access article distributed under the terms of the Creative Commons Attribution License (CC (http://creativecommons.org/licenses/by /4.0) of Drought IJTSRD29976 URL: BY 4.0) INTRODUCTION Drought phenomenon is recognized as one of the most destructive natural disasters which can occur practically everywhere on earth irrespective of climate regime (Schubert et al., 2016; WMO, 2016). Drought is normally characterized by a range of negative impacts including reduced water supply, deteriorated water quality, disturbed riparian habitats, land degradation and desertification, crop failure and food shortage, deaths and mass migration, and so forth. Therefore, it usually induces a decrease in worldwide terrestrial net primary production (Zhao and Running, 2010). Drought can be defined as a dangerous natural hazard as a result of insufficiency of precipitation from anticipated or “normal” that, when extended over a season or longer, is inadequate to meet the demands of human activities and the environment (Wilhite and Buchanan-Smith, 2005). Several definitions of drought are in the literature. Nevertheless, practically all the definitions emphasize the deficiency of precipitation (e,g Linsely et al., 1959; Gumbel, 1963; Palmer, 1965; FAO, 1983; WMO, 1986; Dai, 2010; Mastrangelo et al., 2012). By and large, droughts are normally classified into four major categories including agricultural, hydrological, meteorological, and socio-economic droughts (Wilhite and Glantz 1985; AMS 2004; Srivastava and Singh, 2019). Agricultural drought is a total soil moisture deficit; hydrological drought is a shortage of stream flow; Meteorological drought is precipitation deficit; and socio- economic drought is associated with the shortage of some economic goods affected by the drought process (Heim, 2000; Keyantash and Dracup, 2002; Hennessy et al., 2008). Over the years, a number of drought indicators and indices have been developed around the woeld (WMO, 2012). Some of this indicators and indices can be assessed in the handbook of drought indicators and indices published by the World Meteorological Organization in 2016. They are essential in monitoring diverse aspects of the hydrologic succession. Drought indicators are variables or parameters normally used to portray the drought conditions. These parameters include precipitation, temperature, stream flow, groundwater and reservoir levels, soil moisture and snowpack etc. Furthermore, drought indices are numerically calculated representations of drought severity based on climatic or hydro-meteorological data including the indicators. Though, there are a number of indices to quantify drought using meteorological data, the Standardized Precipitation Index (SPI) is the most widely used index (Jain et al., 2010). The SPI was formulated (Mckee et al., 1993) based on the probability of precipitation for any time scale. It makes drought assessment easier and has a wide range of meteorological, hydrological and agricultural applications (Hayes, 1999). However, remote sensing data and methods are critical tools for studying the spatiotemporal evaluation and the underlying drivers of droughts due to limited availability and inconsistency of drought-related in-situ data (Okeke and Mohammed; Rojas et al., 2011; Naumann, et al., 2014). Remote sensing offers the opportunity to obtain @ IJTSRD | Unique Paper ID – IJTSRD29976 | Volume – 4 | Issue – 2 | January-February 2020 Page 297
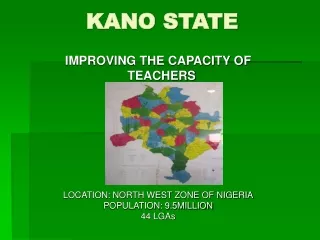
International Journal of Trend in Scientific Research and Development (IJTSRD) @ www.ijtsrd.com eISSN: 2456-6470 continuous, consistent and timely information on meteorological, hydrological and biophysical parameters over large areas and long time periods. The main objective of the current study is to evaluate drought occurrence in Kano State, Nigeria. The methodology encompasses the satellite- based generation of Normalized Difference Vegetation Index (NDVI) and computation of SPI from monthly meteorological data MATERIALS AND METHODS A.Description of the Study Area Kano State is located in the North region of Nigeria on a land mass of 20,280 square kilometers between latitudes 10º 30’ and 12º 45’ north of the equator, and longitudes 7º 10’ and 9º 20’ east of the Greenwich Meridian (Figure 1). It has common boundaries with Katsina State to the north-west, Jigawa State to the north-east, Bauchi State to the south-east and Kaduna State to the south-west. The study area which inhabits a total population of 9,401,288 is predominantly characterized by primary socio- economic activities such as farming, local crafts, trading and livestock rearing among others. Subsistence and commercial agriculture is mostly practiced in the outlying districts of the state. Some of the food crops cultivated are millet, cowpeas, sorghum, maize and rice for local consumption while groundnuts and cotton are produced for export and industrial purposes. Other farm produce found in the study area include sesame, soybean, cotton, garlic, gum arabic and chili pepper. Fig.1: Location of the Study Area-( left is the map of Nigeria showing all the States of the federation with Kano depicted in red boundary; right is the map of Kano State showing all the Local Government Areas B.Data Satellite datasets and in-situ metrological data were appropriately utilized in conducting the current study. The MODIS-NDVI (MOD11B1.A2018344.h18v07.006.2018346211304.tif) which covers the study area was acquired for the period of the study (January to December, 2018) from the United States Geological Survey (USGS) archives at the University of Maryland, USA through the Earth explorer (www.earthexplorer.usgs.gov). Also, the Rainfall data of the study area for 2018 was acquired from NiMET (Nigerian Meteorological agency, Abuja). C.Drought Indices i. Normalized Difference Vegetation Index (NDVI) NDVI is used to classify drought conditions and determine the beginning, especially in areas where drought incident are localized and ill defined. It is normally computed using the following equation NDVI= (NIR-RED)/ (NIR-RED)…….…… [1] Where, NIR and RED are reflectance in the Near Infra-red and Red bands respectively. NDVI measures greenness and vigour of vegetation, and can be used to identify drought-related stress to vegetation. Its values usually ranges from −1 to +1, with values near zero indicating no green vegetation and values near +1 indicating the highest possible density of vegetation. Areas of barren rock, sand, and snow produce NDVI values of <0.1, while shrub and grassland typically produces NDVI values of 0.2–0.3. Also, temperate and tropical rainforests produce values in the 0.6–0.8 range. Generally, the magnitude and evolution of the NDVI for a particular location are mainly governed by meteorological variables such as precipitation, temperature, and relative humidity. ii. Standardized Precipitation Index (SPI) Even though there are many indices used in relation to drought such as for computing drought related parameters, assessing drought severity and classifying it, the SPI is the most extensively used index (Jain, 2010). Its calculation can be carried out at different time scales, and it can concurrently monitor dry conditions on a particular time scale and wet conditions on a dissimilar time-scale. By and large, the rainfall difference from the mean of an equal normally distributed function with a mean @ IJTSRD | Unique Paper ID – IJTSRD29976 | Volume – 4 | Issue – 2 | January-February 2020 Page 298
International Journal of Trend in Scientific Research and Development (IJTSRD) @ www.ijtsrd.com eISSN: 2456-6470 0 and a standard deviation of 1 gives the SPI. Using a drought index, such as SPI, leads to more suitable understanding of drought duration, magnitude, and spatial extent in a given area (Karavitis et al. 2011), hence its use in the current study based on the general values indicated in table 1. Category Extreme drought Severe drought Moderate drought Near normal Moderate wet Severe wet Extreme wet Table1: SPI Classification RESULTS AND DISCUSSIONS The results in this study are presented in figures 2 to 8, and table 2. Figures 2 to 7 shows monthly NDVI maps of the study area for 2018, and figure 8 depicts the trend in NDVI and SPI, while table 2 shows the statistics of monthly NDVI and SPI for each month. The NDVI statistics covers maximum, minimum, and mean NDVI values as well as the standard deviations of the NDVI values. Though, the mean NDVI values vary with month, they are positive throughout the study period, while the SPI values have both negative and positive values. The mean NDVI curve (Figure 8) reflects a nearly straight trend from January to May and increased gradually to August and September. There is a gradual decline from September to December. This is similar to the SPI curve (Figure 8), which though, depicts sharp curve in some months; it shows a nearly straight line from January to April from where it shows an abrupt increase. Also, there is a sudden fall in the SPI profile from July through October to December. It is observed from the results of this study that the months which exhibits low SPI equally shows low mean NDVI and the reverse is the case. The lowest and highest mean NDVI values are 0.208 (March, April) and 0.589 (August) respectively; while the lowest and highest SPI are -0.788 (January to April, November and December) and 1.821 (August) respectively. It is apparent from table 2 and Figure 8 that the SPI values from June to August falls within the threshold categorized as near normal and wet (table 1). They are: June (1.357; moderately wet), July (0.953; near normal), August (1.821; very wet). The mean NDVI for these months shows a similar trend in which case, the values from June to August are 0.112, 0.115, and 0.106 respectively. Generally, NDVI values in this range signify healthy vegetation, which is to a reasonable extent a function of available water to the vegetation. Thus, it is justifiable to conclude that there was no drought occurrence from May to September of 2018 in Kano State. On the other hand, during the months of January to April and October to December, the SPI shows negative trend and the mean NDVI values reveal a low condition. The SPI values for these months are -0.788 apart from October which records -0.644. Of course, this is an indication of near normal condition in terms of drought classification (table 1). Though, the SPI value for the months of May (0,512) and September (0.730) are positive, they fall within the same near normal condition. Moreover, the low values of the mean NDVI (table 2) for these months imply that the vegetation condition was not good enough, which may be attributed to lack of adequate water required by the vegetal cover. SPI -2 and less -1.5 to -1.99 -1.0 to -1.49 -0.99 to 0.99 1.0 to 1.49 1.5 to 1.99 2.0 + Figure 2: NDVI from Landsat of January (left) and February (right), 2018 @ IJTSRD | Unique Paper ID – IJTSRD29976 | Volume – 4 | Issue – 2 | January-February 2020 Page 299
International Journal of Trend in Scientific Research and Development (IJTSRD) @ www.ijtsrd.com eISSN: 2456-6470 Figure3: NDVI from Landsat of March (left) and April (right), 2018 Figure 4: NDVI from Landsat of May (left) and June (right), 2018 Figure 5: NDVI from Landsat of July (left) and August (right), 2018 @ IJTSRD | Unique Paper ID – IJTSRD29976 | Volume – 4 | Issue – 2 | January-February 2020 Page 300
International Journal of Trend in Scientific Research and Development (IJTSRD) @ www.ijtsrd.com eISSN: 2456-6470 Figure 6: NDVI from Landsat of September (left) and October (right), 2018 Figure 7: NDVI from Landsat of November (left) and December (right), 2018 Table2: NDVI and SPI statistics Month NDVIMax NDVIMin NDVIMean NDVISd Jan 0.595 -0.200 Feb 0.469 -0.199 Mar 0.465 -0.198 Apr 0.590 -0.196 May 0.710 -0.197 Jun 0.735 -0.197 Jul 0.866 -0.196 Aug 0.859 -0.190 Sep 0.790 -0.200 Oct 0.766 -0.196 Nov 0.706 -0.199 Dec 0.595 -0.200 Source: Authors’ Lab work, 2019 SPI -0.788 -0.788 -0.788 -0.788 0.512 1.357 0.953 1.821 0.730 -0.644 -0.788 -0.788 0.286 0.212 0.208 0.208 0.224 0.330 0.474 0.589 0.587 0.506 0.351 0.286 0.051 0.037 0.043 0.046 0.082 0.112 0.115 0.106 0.103 0.092 0.071 0.051 @ IJTSRD | Unique Paper ID – IJTSRD29976 | Volume – 4 | Issue – 2 | January-February 2020 Page 301
International Journal of Trend in Scientific Research and Development (IJTSRD) @ www.ijtsrd.com eISSN: 2456-6470 Figure8: Line graph showing the trend in the NDVI and SPI Conclusion Drought is a natural hazard that occurs through a slow process starting with precipitation deficit, through soil moisture deficit, to higher land surface temperature, and to poor vegetal condition. It is anticipated that the future will witness increased dynamics in Hydro-meteorological variables around the world which will lead to frequent droughts whose impacts will be compounded by growing water demands. The 12 months time series of NDVI and SPI for Kano State of Nigeria has been analyzed so as to explore their relationship, and to also use them to determine drought occurrence. The study reveals a consistent relationship between SPI and NDVI, and the absence of drought in some months, as well as near normal conditions in others. Finally, the results in this paper demonstrate the potency of monitoring drought by integrating satellite and in-situ data. References [1]American Meteorological Society. (2004). Statement on meteorological drought. Bull. AMS. 85, pp. 771–773. M., Mitchell, C., and Plummer,N. (2008). An assessment of the [9]impact of climate change on thenature and frequency of exceptional climatic events: Report byClimate and Ocean Services Bureau of Meteorology, CSIROClimate Adaptation Flagship and Drought Policy Review ClimateChange Division Department of Agriculture Fisheries and Forestry,Australia [10]Jain, S. K., Keshri, R., Goswami, A., and Sarkar, A. (2010) Application of meteorological and vegetation indices for evaluation of drought impact: a case study for Rajasthan, India. Nat Hazards 54, pp. 643–656. [11]Karavitis, C. A, Alexandris, S., Tsesmelis, D. E., and Athanasopoulos, G. (2011) “Application of the Standardized Precipitation Index (SPI) in Greece. Water J” 3:787–805. doi:10.3390/w3030787. [12]McKee, T. B., Doesken, N. J., Kleist, J., (1993). The relationship of drought frequency and duration to time scales. In: Proceedings of Eighth Conference on Applied Climatology, Anaheim, CA. American Meteorological Society, Boston, MA, pp. 179–184. [2]Srivastava1, A., and Singh, G. (2019). Meteorological drought intensity assessment using Standardized Precipitation Index. Int. Res. J. Eng. and Tech. 06(10), pp. 80-87. [13]Keyantash, J., and Dracup, J.A., (2002). The quantification of drought: an evaluation of drought indices. Bull. AMS. 83, pp. 1167–1180. [3]Dai, A. (2010). Drought under global warming: a review. WIREs Clim. doi:10.1002/wcc.81 Chang. 2, pp. 45–65. [14]Linsely, R. K. Jr., Kohler, M. A., and Paulhus, J. L. H. (1959). Applied hydrology. McGraw Hill, New York [4]Food and Agriculture Organization. (1983). Guidelines: land evaluation for rainfed agriculture. FAO Soils Bull. 52, Rome [15]Mastrangelo, A. M., Mazzucotelli, E., Guerra, D., De Vita, P., and Cattivelli, L. (2012). Improvement of drought resistance in crops: from conventional breeding to genomic selection. In: Venkateswarlu et al (eds) Crop stress and its management: perspectives and strategies. Springer Science + Business Media B.V. [5]Gumbel, E. J. (1963). Statistical forecast of droughts. Bull. Int. Assoc. Sci. Hydrol. 8(1), pp. 5–23 [6]Hayes, M., Wilhite, D. A., Svoboda, M. and Vanyarkho, O. (1999). Monitoring the 1996 drought using the Standardized Precipitation Index. Bull. AMS. 80, pp. 429-438. [16]Naumann, G., Dutra, E., Barbosa, P., Pappenberger, F., Wetterhall, F., and Vogt, J. V. (2014). Comparison of drought indicators derived from multiple data sets over Africa. Hydrol. Earth Syst. Sci. 18, pp. 1625–1640. [7]Heim, R. R. (2002). A review of twentieth-century drought indices used in the United States. Bull. AMS. 83(8), pp.1149–1166. [17]Okeke, F. I., and Mohammed, S. O. (2007). Early Warning for Food Security for Nigeria using NigeriaSat- 1 and other Satellite Images: Applicable Tools and Techniques. Nigerian Journal of Space Research, 4, pp. 91-126. [8]Hennessy, K., Fawcett, R., Kirono, D., Mpelasoka, F., Jones, D., Bathols, J.,Whetton, P., Stafford, M., Howden, @ IJTSRD | Unique Paper ID – IJTSRD29976 | Volume – 4 | Issue – 2 | January-February 2020 Page 302
International Journal of Trend in Scientific Research and Development (IJTSRD) @ www.ijtsrd.com eISSN: 2456-6470 [18]Palmer, W. C. (1965). Meteorological drought. US Department of Commerce, Weather Bureau, Research Paper No. 45, p. 58. [22]Wilhite, D. A. and Glantz, M. H. (1985). Understanding the drought phenomenon: The role of definitions. Water Int., 10(3), pp. 111–120. [19]Rojas, O., Vrieling, A., and Rembold, F. (2011). Assessing drought probability for agricultural areas in Africa with coarse resolution remote sensing imagery. Rem. Sens. Environ. 2011, 115, 343–352. [23]World Meteorological Organization. (1986). Report on drought and countries affected by drought during 1974–1985. WMO, Geneva, p. 118 [24]World Standardized Precipitation Index User Guide. In (M. Svoboda, M. Hayes and D. Wood). WMO-No. 1090, Geneva. Meteorological Organization. (2012). [20]Schubert, S. D., Stewart, R. E., Wang, H., Barlow, M., Berbery, E. H., Cai, W., Hoerling, M. P., Kanikicharla, K. K., Koster, R. D., Lyon, B., et al. (2016). Global meteorological drought: A synthesis of current understanding with a focus on sst drivers of precipitation deficits. J. Clim. 29, pp. 3989–4019. [25]World Meteorological Organization (WMO) and Global Water Partnership (GWP). (2016). Handbook of Drought Indicators and Indices (M. Svoboda and B.A. Fuchs). Integrated Drought Management Programme (IDMP), Integrated Drought Management Tools and Guidelines Series 2. Geneva. [21]Wilhite, D. A., and Buchanan-Smith, M. (2005). Drought as hazard: understanding the natural and social context. In: Wilhite DA (ed) Drought and water crises: science, technology, and management issues. CRC Press, Taylor & Francis Group, Florida, pp. 3–29 [26]Zhao, M. S., and Running, S. W., (2010). Drought- induced reduction in global terrestrial net primary production from 2000 through 2009. Science 329 (5994), pp. 940–943. @ IJTSRD | Unique Paper ID – IJTSRD29976 | Volume – 4 | Issue – 2 | January-February 2020 Page 303