Download
1 / 10
100 likes | 113 Views
The north east region covers an area of about 2,62,239 sq.km. It is about 7.9 percent of Indias total area. They had a population of around 45.5 million in 2011, which was about 3.77 percent of Indias total population. Census of India 1991, 2001 and 2011 data were analysed with different indices to know the level, growth and distribution of urban population and towns. The level of urbanization increases from one census to another census in every state. Towns were unevenly distributed in the region. Most of the towns were small towns. Only few districts in the region attained urbanization level of 50 percent and above. Urbanization in the region is different from the mainland India. The urban centres are the administrative centres. The market penetration and social change has been very limited in the urban areas. N. Pautunthang "Urbanization in North East India 1991 2011" Published in International Journal of Trend in Scientific Research and Development (ijtsrd), ISSN: 2456-6470, Volume-2 | Issue-6 , October 2018, URL: https://www.ijtsrd.com/papers/ijtsrd18631.pdf Paper URL: http://www.ijtsrd.com/humanities-and-the-arts/social-science/18631/urbanization-in-north-east-india-1991-:--2011/n-pautunthang<br>

E N D
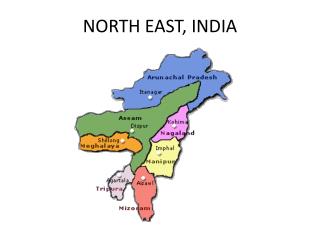
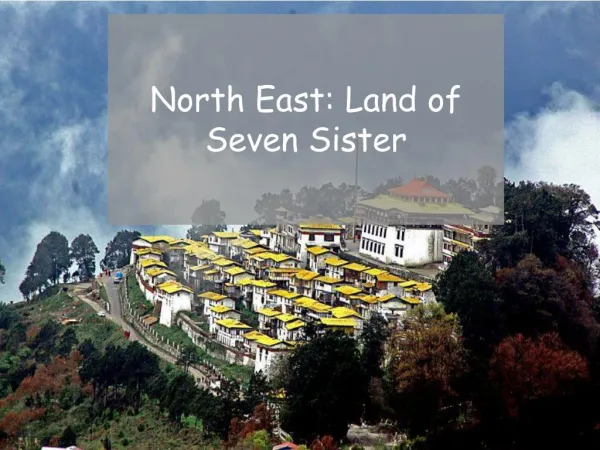
International Journal of Trend in Scientific Research and Development (IJTSRD) International Open Access Journal | www.ijtsrd.com ISSN No: 2456 - 6470 | Volume - 2 | Issue – 6 | Sep – Oct 2018 Urbanization in North East India 1991 – 2011 N. Pautunthang Ph. D Research scholar, Institute for Social and Economic Change, Bangalore, Karnataka, India ABSTRACT The north east region covers an area of about 2,62,239 sq.km. It is about 7.9 percent of India's total area. They had a population of around 45.5 million in 2011, which was about 3.77 percent of India's total population. Census of India 1991, 2001 and 2011 data were analysed with different indices to know the level, growth and distribution of urban population and towns. The level of urbanization increases from one census to another census in every state. Towns were unevenly distributed in the region. Most of the towns were small towns. Only few districts in the region attained urbanization level of 50 percent and above. Urbanization in the region is different from the mainland India. The urban centres are the administrative centres. The market penetration and social change has been very limited in the urban areas. Keywords:Tempo of urbanization, exponential growth, median inhabitant, rank size rule, primacy index. INTRODUCTION North east India refers to the eastern corner of India surrounded by five foreign countries such as Bangladesh, China, Bhutan, Bangladesh and Myanmar. It comprises of eight states namely Arunachal Pradesh, Assam, Manipur, Meghalaya, Mizoram, Nagaland, Sikkim and Tripura. They are collectively known as eight sisters.The region covers an area of about 262,239 sq.km. It is about 7.9 percent of India's total area. They had a population of around 45.5 million in 2011, which was about 3.77 percent of India's total population. Urbanization is a process by which people, instead of living in predominantly dispersed agricultural village, start living in towns and cities dominated by industries and service sectors. It involves an increase in the size of existing towns and cities. The process of society’s transformation from a predominantly rural to a modern urban population is urbanization. It includes two things; an increase in the number of people living in urban settlements and an increase in the percentage of the population engaged in non-agricultural activities, living in such places. The criteria used to define a place as urban in censuses of different countries differ very much. It is difficult to set a standard population size norm for a place to be designated as urban. Many countries used minimum population size as one of the important criteria to define a place as urban. This size again differs tremendously across countries. United Nations, for international comparability, has recommended a population of 20,000 as the cut off point for a place to qualify to be called urban. An urban area, according to census of India definition consists of: 1.All statutory towns: All places with a municipality corporation, cantonment board or notified town areas committee etc. so declared by the state law and 2.Census towns: Places which satisfy the following criteria: A.A minimum population of 5000 B.At least 75% of male working population engaged in non agricultural pursuits C. A density population of at least 400 persons per square kilometre In addition, some areas falling near city or town are also considered as urban area if they are treated as the outgrowth (OGs) of the main urban unit. REVIEW OF LITERATURE: Urbanization is a finite process of cycle through which nation passes from agrarian to industrial @ IJTSRD | Available Online @ www.ijtsrd.com | Volume – 2 | Issue – 6 | Sep-Oct 2018 Page: 711
International Journal of Trend in Scientific Research and Development (IJTSRD) ISSN: 2456-6470 society (Davis and Golden, 1954). According to Hauser (1957), rapid population growth in cities of developing countries are seen as an outcome of heavy influences of rural migrants to the cities, which had been pushed from the agricultural field, rather than pulled by the urban non agricultural sector. The urbanization is a process that involves the multiplication of population as well as an increase in the size of individual urban concentration (Gibbs J.P, 1966). Sovani (1966) urbanization is often termed as over urbanization. It means the big cities attained inordinately large population size leading to virtually collapse in the urban services. It has been followed by the basic problem in the field of housing, slum, infrastructure, and quality of life. Urbanization is an index of transformation from traditional rural economies to modern industrial one. Kingsley Davis has explained urbanization is a long- term process. It is a process to spread out pattern of human settlements of concentration in urban centres (Davis, 1962). Davis (1968) mentioned three stages in the process of urbanization. Stage 1 is the initial stage characterized by rural traditional society with predominance in agriculture and dispersed pattern of settlements. Stage 2 refers to acceleration stage where basic restructuring of the economy and investments in social overhead capitals including transportation, communication, etc. takes place. Proportion of urban population gradually increases from 25% to 40%, 50%, 60% and so on. Dependence on primary sector gradually dwindles. Stage 3 is also known as terminal stage where urban population exceeds 70% or more. At this stage, level of urbanization remains more or less same. The rate of growth of urban population and total population becomes same at terminal stage (Davis, 1965). Breese (1969) depicts urbanization in India as pseudo urbanization where people arrive in cities not due to urban pull but due to rural push. The term urbanization is intimately industrialization, modernization and westernization (Saxena, 1970). Urbanization is closely inter-linked with other processes like migration, industrialization and modernization and these three works in conjunction. (Singh, R.B. 1993). The spatial distribution of urban units in northeast India gets more and more uneven at higher levels of urban concentration.Within the state, urbanization is uneven which too suggest a high potential for a more balanced pattern of urbanization in future (Khawas, Vimal, 2005). A mere 13 per cent of the global population lived in urban areas in 1900. This proportion increased to 29 per cent in 1950 and about 50 per cent by the close of the twentieth century (United Nations 2006). The north eastern states revealed much lower contribution of migration than the national average. (Bhagat, R.B, & Mohanty, Soumya, 2009). The percentage of urban population to the population in NE region is increasing over the census years, but still lower than the national’s figures (Devi, Kh. Bimolata, 2012). Number of class I towns or Class II towns are growing faster than the growth in number of small towns in north east India. Despite the increase in the number of towns as a whole, it is seen that growth of Class VI category i.e. small town is negative (Hoque, Azimul 2013). RESEARCH GAP: In India, there is lack of data on urbanization. Census data have been and still are the main source of information on urbanization in India. It is only in every ten years that we get an opportunity to know about the overall urbanization India by studying the census data. Urbanization occupies a very important place in the field of population studies. Globalization of urbanization is a recent phenomenon. The study of different aspects of urbanization is important to have a proper understanding of the urbanization phenomenon in north eastern India. It is well known that the north eastern states are less developed region. The globalization had affected every nook of India but not north east. For the mainstream India, plenty of literatures are available for the study of urbanization. However; very few researchers have attempted urbanization issues of north east. Most of them exclude Sikkim in their analysis. The bulk of urban literatures talk only of the major states of India in which the north eastern states except Assam are not a part. As a result, there is shortage of literature in urbanization with reference to north eastern India. Therefore, research in this field is very challenging. Urbanization is an important modernization and development. If the level of urbanization is high, they are socially and economically more prosperous. On the other hand, if it is low, they are socio economically backward. Urbanization is highly linked with development. observed that India’s to examine the related with indicator of @ IJTSRD | Available Online @ www.ijtsrd.com | Volume – 2 | Issue – 6 | Sep-Oct 2018 Page: 712
International Journal of Trend in Scientific Research and Development (IJTSRD) ISSN: 2456-6470 There is not much focus on study of urbanization in the north eastern states. Accordingly, this paper is a humble attempt to understand urbanization in north eastern India. OBJECTIVES: 1.To ascertain the level of urbanization in north east India. 2.To analyze the growth of urban population and towns in north east India. 3.To understand the distribution and concentration of urban population in north east India. SOURCES OF DATA: The basic data needed for the study of urbanization is available mainly from the census. The British ruler conducted the first census in India in 1872. The complete census of population was conducted in 1881. Since then the census is being regularly conducted at an interval of ten years. The census has collected different kind of information on population. For the study of urbanization, the data is needed on urban volume and population size structure of the urban centres as well as the components of urban population growths. The Indian census presents urban data by urban- rural classification and number of towns with their populations. Various census volumes have been used to collect information on urbanisation such as Town Directory, Urban - Rural Classification and District Census Handbook. The 1981 census was not conducted in Assam and some states like Nagaland, Arunachal Pradesh, Manipur, etc. emerged only after 1980s.Due to this, it is not possible to study before 1990s.This paper attempts to study from 1991 census onwards only. The different volumes of 2011 census data are not yet available. Therefore, census data of 1991 to 2011 has been used for the analysis. METHODOLOGY: Different indices have been used in this study. The following formulas were used to calculate different indexes: PU=U/P*100 Where, PU= Percent urban. U= Urban population of a specified area. P= Total population of a specified area. UR=U/R*100 Where, UR= Urban rural ratio of a specified area. U= Total urban population of a specified area. R= Total rural population of a specified area. MI=Qi+(Qi+1-Qi)(50-PPi)/(PPi+1-PPi) Where, MI=Median Inhabitant PPi=The cumulative percent of population for the locality size category just under 50 percent PPi+1=The cumulative percent of the next locality size category Qi=Upper limit of the locality size category ‘i’ Qi+1=Upper limit of the locality size i+1 Ci2 MC = P Where, MC = Mean city Ci =The population of city i n= The total number of cities. P=The total population of the country (or state). Ur= 1/n*ln{(Ut+n)/Ut}*100 Where, Ur= Growth Rate of Urban Population. n=Number of years. ln=Natural Logarithm Ut= Urban Population at time t years. Ut+n=Urban Population at time t+n years. TA=1/n*ln(PU t+n/PUt)*100 Where, TA= Tempo of urbanization n= Number of years ln=Natural logarithm PUt+n= Percent urban Population at the year t+n. PUt= Percent urban Population at the year t. [ ln C1 * ln (K)] Ck Z = [ln (K)]2 Where, Z= Constant of the city index distribution. C1= The population of the largest city. Ck= The city ranked in place k from the largest to smallest city in population size. k= Rank order. PI4= C1/C2+C3+C4 Where, PI4 = Four city Primacy Index @ IJTSRD | Available Online @ www.ijtsrd.com | Volume – 2 | Issue – 6 | Sep-Oct 2018 Page: 713
International Journal of Trend in Scientific Research and Development (IJTSRD) ISSN: 2456-6470 C1 = It is the population of the largest city. C2 to C4= Population of second, third and fourth ranked cities. PI11= C1/ C2+C3+C4+…..C10 Where, P11=Eleven city primacy index C1= the population of the largest city. C2 – C10 = Population of second, third, fourth up to the tenth cities. GI= XiYi+1 - XiYi Where, Xi=Cumulative population. Yi=Cumulative proportions of urban localities. n= Number of urban localities. RESULTS AND DISCUSSION: Level of urbanization: Table 1 shows the level of urbanisation in the north eastern region in terms of per cent urban and urban rural ratio during the period 1991 -2011. Percent urban refers to the number of persons living in urban localities for each 100 people living in the country (or state). Higher the percent urban higher is the level of urbanization. Throughout the study period, there was a continuous increase of urban population percentage over the year in all the states except Manipur in census 2001. The 2001 census could not held in some districts of Manipur therefore it shows a declining trend from 1991 to 2001. Mizoram ranked the top having highest percentage (51.51%) of urban population among the northeastern states throughout the study period. It is the only state from north east with more than 50% level of urbanization. In the early period of the study (1991 & 2001), Sikkim ranked lowest. In the latest census, Assam (14.08%) ranked the lowest so far urban population is concerned, followed by Meghalaya, Arunachal Pradesh and Sikkim. The percentage share of urban population in north east increasing over the census years. According to 2011 census, the percent urban of north east as a whole is 18.36% that is still much lower than the national average. proportion of urban Table 1: Percent Urban and Urban Rural ratio of North East (statewise) 1991-2011 Percent Urban 1991 2001 Arunachal Pradesh 12.8 20.75 Assam 11.1 12.9 Manipur 27.52 26.58 Meghalaya 18.6 19.58 Mizoram 46.1 49.63 Nagaland 17.21 17.23 Sikkim 9.1 11.07 Tripura 15.29 17.06 North East 13.82 15.66 Urban Rural Ratio 1991 2001 14.67 26.19 12.48 14.81 37.98 36.21 22.84 24.35 85.51 98.53 20.79 20.81 10.02 12.45 18.06 20.57 16.05 18.57 States 2011 22.67 14.08 30.21 20.08 51.51 28.97 24.97 26.18 18.36 2011 29.31 16.38 43.27 25.11 106.22 40.78 33.27 35.45 22.48 The urban rural ratio measures the number of city dwellers per rural inhabitant. It measures the relative number of urbanities for each rural person in an area. It gives the number of urban dwellers for each person living in rural areas. An index value of 1 means that the urban population is equal to rural population. The urban rural ratio also shows the same scenario like the percent urban. Table 2 shows the median inhabitant and mean city population size of different states of north- east during 1991 - 2011. Median inhabitant establishes the size of the locality where the median inhabitant lives. It denotes the size of the locality inhabited by the person occupying the fiftieth percentile. Higher the city size of the median inhabitant, the higher is the level of urbanization. The median inhabitant was fluctuating in the states of Arunachal Pradesh, Meghalaya and Mizoram. It is continuously increasing in the states of Assam. In the state of Sikkim, the median inhabitant increase from 2001 to 2011. In the states of Manipur, Nagaland and Tripura the figure decrease from 2001 to 2011. Mizoram is the highest in terms of median inhabitant whereas Arunachal Pradesh is the lowest as per census 2011. @ IJTSRD | Available Online @ www.ijtsrd.com | Volume – 2 | Issue – 6 | Sep-Oct 2018 Page: 714
International Journal of Trend in Scientific Research and Development (IJTSRD) ISSN: 2456-6470 Table 2: Median Inhabitant and Mean City Population Size of North East(statewise) 1991-2011 Median Inhabitant 1991 2001 Arunachal Pradesh 12,557 27,621 Assam 45,986 47,212 Manipur 33,535 33,535 Meghalaya 27,791 62,986 Mizoram 66,219 55,764 1,10,287 Nagaland 52,068 52,068 Sikkim 6,303 6,303 Tripura 36,177 36,177 Mean city size Population 1991 2001 14,225 43,236 1,17,090 4,42,045 1,39,170 1,48,741 61,018 88,932 1,20,557 2,18,875 35,846 59,046 3,369 6,627 55,433 93,099 States 2011 18,219 47,689 22,462 45,801 2011 72,791 6,19,990 2,43,649 91,346 2,97,958 1,64,772 38,629 2,51,609 32,669 27,028 32,425 The growth rate is highest in Sikkim and lowest in Manipur according to 2011 census. In Sikkim, the exponential growth rate was 4.81 during 1991 – 2001 that suddenly increased to 9.3 during 2001 -2011. In case of Manipur, the growth rate was 1.3 during 1991- 2001, it gradually decreased to 0.04 during 2001 – 2011. Tempo of urbanization refers to the speed of urbanization and measured as change registered in the level of urbanization over the years. It needs to be mention that tempo of urbanization measured, as per cent will tend towards zero as the urban population reaches 100 per cent level, since the urban and total population growth would become the same. The tempo of urbanization can be calculated in different ways, exponential model has been used for the analysis. Mean city size index tells the size of the city in which the average person lives. The mean city population size was increasing in all the states. Assam is highest in terms of mean city population size whereas Sikkim is the lowest. Growth of urban population and towns: Table 3 highlights the exponential growth and tempo of urbanization across north eastern India during 1991 - 2011. Exponential model have been used to calculate the growth rate of urban population in this paper. Only three states such as Meghalaya, Sikkim and Tripura showed a significant improvement in urban growth rate. The rest of the states including north east as a whole experienced a declining urban growth rate. Table 3: Exponential Growth and Tempo of Urbanization of North East(statewise) 1991 – 2011 Exponential Growth 1991 – 2001 Arunachal Pradesh 7.23 Assam 3.24 Manipur 1.3 Meghalaya 3.19 Mizoram 3.27 Nagaland 4.98 Sikkim 4.81 Tripura 2.58 North East 3.2 It is obvious from the table that tempo or speed of urbanization is not uniform over time across states. While the states of Manipur, Nagaland, Sikkim and Tripura shows an increasing trend other states such as Arunachal Pradesh, Assam, Meghalaya and Mizoram shows a declining trend. The north east as a whole shows an increasing tempo of urbanization. During Tempo of urbanization 1991- 2001 4.83 1.5 0.35 0.51 0.74 0.01 1.96 1.1 1.25 States 2001 - 2011 3.19 2.44 0.04 5.94 3 4.94 9.3 5.66 3.18 1991 – 2001, the fastest tempo of urbanization was Arunachal Pradesh but during 2001 – 2011 Sikkim overtook Arunachal Pradesh. The slowest tempo of urbanization during 1991 – 2001 was Nagaland but Meghalaya replaced it during 2001 – 2011. In Sikkim the tempo of urbanization was 1.96 during 1991 – 2001and it tremendously increased to 8.13 during 2001 -2011 0.88 0.88 0.86 0.25 0.37 5.2 8.13 4.28 1.59 @ IJTSRD | Available Online @ www.ijtsrd.com | Volume – 2 | Issue – 6 | Sep-Oct 2018 Page: 715
International Journal of Trend in Scientific Research and Development (IJTSRD) ISSN: 2456-6470 2001 – 2011. In case of Arunachal Pradesh, the tempo of urbanization was 4.83 during 1991 – 2001 and it suddenly increased to 0.88 during 2001 – 2011. Table 4 shows number of towns by size class of north east as a whole during 1991 – 2011. In 1991, the north east region had 204 towns in all. This number rose to 254 in 2001 and 416 in 2011 census. Across size class, it can be seen that there was a trend of increase number of towns except class VI towns in 2001. The Table 4: Percentage distribution of size class towns in north east, 1991 – 2011 Census years No. of towns Cities Class I 7 3.43 Large town Class II 7 3.43 Medium town Class IV 62 30.39 Class V 57 27.94 Class VI 36 17.65 All Classes 204 100 The small towns especially class IV and V towns are more in where as class I and II are very less during 1991 - 2011. In 1991, class IV towns contribute 30.39% of the total towns of north east India. The percentage share declined to 28.35% in 2001 and 26.92% in 2011 census respectively. In case of case V town, it contributes 27.94% of the total towns of north east India in 1991. This figure increased to 35.04% in 2001 and 38.7% in 2011. Sikkim has least number of towns whereas Assam has the largest number of towns during 1991 - 2011. Sikkim has only 8 towns in 1991 and it does not have class I town till 2001. In 2011 census, it has single class I town. The state of Arunachal Pradesh does not have class I town over the study period. In case o Assam, it has all the size class towns since 1991 census. Out of the total 204 towns in 1991, 94 towns belonged to Assam state that is 46.08% of the total towns of north east. The percentage share of Assam in total towns of north east increased to 49.21% in 2001 and 51.20% in 2001 census respectively. In 1991, Assam contribute more half in each category of class II, III and IV towns of north east. Guwahati is the most populous city in the north east. region has 36 class VI towns in 1991 and it was decreased to 25 in 2001 but again increased to 61 in 2011 census. The percentage share was fluctuating. The total number of class I, II and III towns increase from 1991 – 2011 but the percentage share was fluctuating. The absolute numbers of class IV increase over the period but the percentage share decreases. Class V towns shows increasing trend of absolute number as well as percentage share. 1991 2001 2011 Town categories No. of towns 9 11 No. of towns 12 13 Size Class Percentage Percentage Percentage 3.54 4.33 2.88 3.13 Class III 35 17.16 48 18.90 57 13.7 72 89 25 254 28.35 35.04 9.84 100 112 161 61 416 26.92 38.7 14.66 100 Small town Concentration population and towns: In this section, I look at the data on levels of urbanisation in different districts of the north eastern states. District wise percent urban had been computed based on census data of 1991, 2001 and 2011. The level of urbanisation in various districts had been classified into six categories and assigned the relevant terms as under: 50% and above 40 - 50% 30 - 40% 20 - 30% 10 - 20% Below 10% Table 5 shows the spatial distribution of urbanization across districts of whole north east in different censuses. The category of very high, high, moderate and low level of urbanization increases from one census to the next census. The medium level of urbanization was fluctuating. The very low level of urbanization was continuously decreasing. and distribution of urban Very High High Medium Moderate Low Very Low @ IJTSRD | Available Online @ www.ijtsrd.com | Volume – 2 | Issue – 6 | Sep-Oct 2018 Page: 716
International Journal of Trend in Scientific Research and Development (IJTSRD) ISSN: 2456-6470 Table 5: Spatial distribution of urban in districts of north east, 1991 – 2011 Range of Urbanization (Percent Urban) 50 and above 40 – 50 30 – 40 20 – 30 10' - 20 Below 10 Total 1991 2001 2011 No. of districts 1 1 4 3 16 33 58 No. of districts 5 3 6 9 25 27 75 No. of districts 6 7 4 12 34 23 86 Percentage Percentage Percentage 1.72 1.72 6.9 5.17 27.59 56.9 100 6.67 4 8 12 33.33 36 100 6.98 8.14 4.65 13.95 39.53 26.74 100 In 1991, there was only one district i.e Aizawl district of Mizoram with very high level of urbanization (50% and above). In 2001 census, 5 districts come under the category of very high level of urbanization. In the next census, 1 more district was added to this category. Lunglei district was the only district with high level of urbanization in 1991. In the next census, 2 more districts were added in this category. In 2011, there were 7 districts with high level of urbanization in north east India. In 1991 census, 4 districts come under medium level of urbanization category. It become 6 in 2001 and again reduced to 4 in 2011. In 1991, 3 districts were in the category of moderate level of urbanization. It was increased to 9 in 2001 and become 12 in 2011 census. In 1991 census, 16 districts come under low level of urbanization. It was tremendously increased to 25 in 2001 and 34 in 2011. 33 districts of north east come under very low level of urbanization in 1991. It decreased to 27 in 2001 and 23 in 2011 census. From the table, it is obvious that the percentage share of low and very low level of urbanization is very high Table 6: Gini Index and Rank Size Rule of North East(statewise), 1991 -2011 Gini Index (GI) 1991 Arunachal Pradesh 0.31 Assam 0.59 Manipur 0.57 Meghalaya 0.6 Mizoram 0.68 Nagaland 0.35 Sikkim 0.58 Tripura 0.49 in different censuses. In 1991 census more than half (56.90%) of the districts of north east India fall under the category of very low level of urbanization. In 2001 36% of the districts of north east India belong to the category of very low level of urbanization. In 2011, the percentage share of low level of urbanization was the highest (39.53%). We can say that 84.49% of the districts were low and very low level of urbanization in 1991. In 2001, 69.33 % of the districts fall under the category of low and very low level of urbanization. In 2011, 66.27% of the districts come under these two categories. Table 6 shows gini index and rank size rule of north east in state wise. One of the dimensions of urbanization process is the concentration of urban population in a few urban areas. Concentration refers to the unevenness in the distribution of the urban population.The Giniconcentration ratio indicates spatial inequalities in the distribution of urban population. It measures the difference between the line of equality and actual situation of the population concentration. Rank Size Rule (Z) 1991 2001 0.07 0.08 0.09 0.12 0.12 0.11 0.2 0.15 0.15 0.15 0.12 0.13 0.24 0.22 0.1 0.09 States 2001 0.32 0.54 0.44 0.64 0.68 0.35 0.03 0.49 2011 0.46 0.09 0.5 0.46 0.68 0.48 0.61 0.52 2011 3.05 1.32 2.25 2.38 1.15 1.43 0.6 0.99 @ IJTSRD | Available Online @ www.ijtsrd.com | Volume – 2 | Issue – 6 | Sep-Oct 2018 Page: 717
International Journal of Trend in Scientific Research and Development (IJTSRD) ISSN: 2456-6470 The gini concentration index shows fluctuating in the states of Manipur, Mizoram and Sikkim. The gini index of Arunachal Pradesh is continuously increasing. This means that concentration of population in larger cities was increasing over time. The state of Nagaland and Tripura also shows increased from 2001 to 2011. Assam state shows a decreasing trend that means decreasing concentration of urban population in large cities. The rank size rule indicates the relationship between the size of the city and their ranks. It has been found that there exist regularity between the size of the city and its rank. The greater value of the index, the greater is the concentration of population in the largest cities relative to the other lower cities. The value of Z is fluctuating for the states of Arunachal Pradesh, Manipur, Meghalaya and Sikkim. The Z value for Assam and Nagaland was continuously increasing over a period. Mizoram also show increasing since 2001. It indicated that the population of the largest city in comparison with other lower order cities was increasing over the period. It reflected urban primacy in these states. It means most of the urban population were concentrated in capital cities. The Z value of Tripura decreased from 1991 to 2001. It indicated that the population of the largest city in comparison with other lower order cities was decreasing over time. This mean urban population was not concentrated in the largest city but spreading in other cities. Primacy Index (P4 & P11) of North East(statewise), 1991 – 2011 Primacy Index(P4) 1991 Arunachal Pradesh 0.37 Assam 6.26 Manipur 2.23 Meghalaya 2.75 Mizoram 3.24 Nagaland 0.59 Sikkim 2.85 Tripura 1.74 When we consider the dominance of the largest city with respect to the second, third.eleventh cities, it is known as P11. From the table, it is interesting to note that the primacy index value (P11) was fluctuating in the states of Assam, Manipur, Nagaland, Sikkim and Tripura. The states of Meghalaya and Mizoram show Table 7 shows the primacy index (P4 & P11) of north eastern states. The primacy index shows the dominance of the largest city with respect to the second largest city or subsequent cities. There is an assumption that if the exponent Z of the rank is one, the size of any city is equal to the largest city divided by its rank. Under this condition, the population of the largest city is equal to the population contained in the second, third and a fraction of the fourth ranked cities. If the assumption is valid, the addition of population in the second, third and fourth ranked cities would be 13/12 of the first city (1/2+1/3+1/4=13/12). The division of the first city by the summation of the population of the three following cities should be close to one if they follow the rank size rule. Thus, the index measures the concentration of the first city in relation to the remaining three cities. The greater the index value, the greater is the concentration in the largest city. When we consider the dominance of the largest city with respect to the second, third and fourth cities, it is known as P4. The P4 value is fluctuating in the states of Arunachal Pradesh, Manipur, Meghalaya and Sikkim. It is continuously increasing in the states of Assam and Nagaland. This indicated that the concentration of urban population in the largest city increased over time. The P4 value decrease from 1991 to 2001 in the state of Tripura. This indicated that concentration of urban population in the largest city decreased tremendously over time. Primacy Index (P11) 1991 2001 0.35 0.53 2.7 1.65 2.3 2.65 4.16 2.87 4.32 2.75 0.76 0.8 4.18 1.92 1.92 1.6 States 2001 0.53 1.84 2.77 2.5 2.44 0.67 1.25 1.68 2011 0.72 2.13 1.19 0.53 2.55 0.71 3.16 4.17 2011 0.7 2.02 1.32 1.14 2.73 0.78 3.76 5.28 a continuously decreasing trend. It indicated that the urban population had been spreading to other cities and not only in the largest city. However, the states of Arunachal Pradesh experienced an increasing trend of primacy index. It indicated that concentration of urban population in the largest city had increased over time. @ IJTSRD | Available Online @ www.ijtsrd.com | Volume – 2 | Issue – 6 | Sep-Oct 2018 Page: 718
International Journal of Trend in Scientific Research and Development (IJTSRD) ISSN: 2456-6470 SUMMARY AND CONCLUSION: In earlier times, north eastern states were very difficult to access because of its hilly terrain. Due to its inaccessibility, developments were very slow. Urbanization also low, as it is associated with development. The second half of the 20th century showed acceleration in the level of urbanisation in the north eastern region. However, the overall process of urbanization is very low in comparison with the mainstream India. The data analysis showed some peculiarities. Towns were not uniformly distributed across districts and the region. Urban units tend to concentrated in and around state headquarters due to economic and administrative reasons. The distribution of urban centres is also highly uneven across the state. There was disparity in the distribution of different size class towns. The number of medium towns had grown since the 1991 census. However, there was not much change in the share of large cities and small towns. Mizoram attained the highest level of urbanization among the north eastern states. The states of Manipur, Nagaland and Tripura are medium level and the rest of the states are low urbanized. There was a slowing down of tempo of urbanization over the period. During the insurgency period of 1980s, the central government carried out a large-scale administrative re-organisation in Mizoram. Several villages re- grouped into one village convenience and to sharpen counter-insurgency operations. This could be one probable reason for high level of urbanization in Mizoram. Urbanization in northeast industrialization and strong economic base. It is mainly a product of demographic explosion and poverty induced rural to urban migration. It is followed by some basic problems in the field of housing, transport, water supply, pollution etc. Most of the cities cannot generate employment for the distress poor people. Most of the north eastern cities were not planned and they grew as trade or administrative centres. The small towns hold immense potential for future growth. However, they are expanding in the most unscientific and unplanned manner in the region. The hilly characteristics constraining the region do not support too many large towns. Hence, medium and higher- order small towns need to be nurtured by decision- makers for planned, long-term sustenance. There is need for policy-makers and planners to look the urban situation in the north east. Urban planners and policy- makers need to evolve possible solutions for checking the increasing urban population. Operational planning should take care of improvement of urban infrastructure. Urban housing and environmental sanitation should emphasize on development of newly annexed urban areas. Proper law is needed to enforce development control and building regulations. Various urban renewal process should be introduced. REFERENCES: 1.Azimul Hoque (2013): “Urbanization pattern in northeast India: TwoCircles.net. http://www.twocircles.net accessed on 17.12.2015 2.Bhagat, R.B and (2009):”Emerging Pattern of Urbanisation and the contribution of migration in urban growth in India. Asian Population Studies”, 5(1), 5-20. 3.Bose, A. (1978):”India’s Urbanization 1901- 2001”, Bombay: Tata Mc Graw Hill Publishing Co.Ltd. 4.Breese, G (1969): “Urbanisation in Newly Developing Countries”, New Delhi: Prentice Hall. 5.Brockerhoff, M (1999): “Urban Growth in Developing Countries: A review of Projections and Predictions. Population and development Review”, 25(4), 757-778. 6.Census of India (1991): “District census Handbook”, New Delhi: Office of the Registrar General and Census Commissioner. 7.Census of India (1991): “Town Directory”, New Delhi: Office of the Registrar General and Census Commissioner. 8.Census of India (1991): ”Provisional Population Totals: Rural Urban Distribution”, New Delhi: Office of the Registrar General and Census Commissioner. 9.Census of India (2001): “District census Handbook”, New Delhi: Office of the Registrar General and Census Commissioner. 10.Census of India (2001): “Town Directory”, New Delhi: Office of the Registrar General and Census Commissioner. 11.Census of India (2001):”Provisional Population Totals: Rural Urban Distribution”, New Delhi: Strategic Available overview”, at Mohanty, Soumya for administrative occurs without @ IJTSRD | Available Online @ www.ijtsrd.com | Volume – 2 | Issue – 6 | Sep-Oct 2018 Page: 719
International Journal of Trend in Scientific Research and Development (IJTSRD) ISSN: 2456-6470 16.Devi, Bimolata Kh (2012): “A study on urbanization in north eastern states of India. International Journal of current Research”, 4(10), 272 -276 17.Sovani, N. V. (1966): “Urbanisation and Urban India”, Bombay: Asia Publishing House. 18.United Nations (2006):”World Urbanization Prospects: The 2005 Revision”, New York: Population Division, United Nations. 19.Vimal Khawas (2005): “Urbanization in the north east: Patterns trends and policy prongs. Social change”, 35(2), 47 – 69 Office of the Registrar General and Census Commissioner. 12.Census of India (2011): “District census Handbook”, New Delhi: Office of the Registrar General and Census Commissioner. 13.Census of India (2011):”Provisional Population Totals: Rural Urban Distribution”, New Delhi: Office of the Registrar General and Census Commissioner. 14.Davies Kingsley and Golden H. H (1954): "Urbanisation and development in pre-Industrial Areas. Economic Development and Cultural Change”, 3(1), 6 -26. 15.Davies, Kingsley (1965):”The urbanization of the human population. Scientific American”, 213(3), 41-53. @ IJTSRD | Available Online @ www.ijtsrd.com | Volume – 2 | Issue – 6 | Sep-Oct 2018 Page: 720